
Fig. 4.
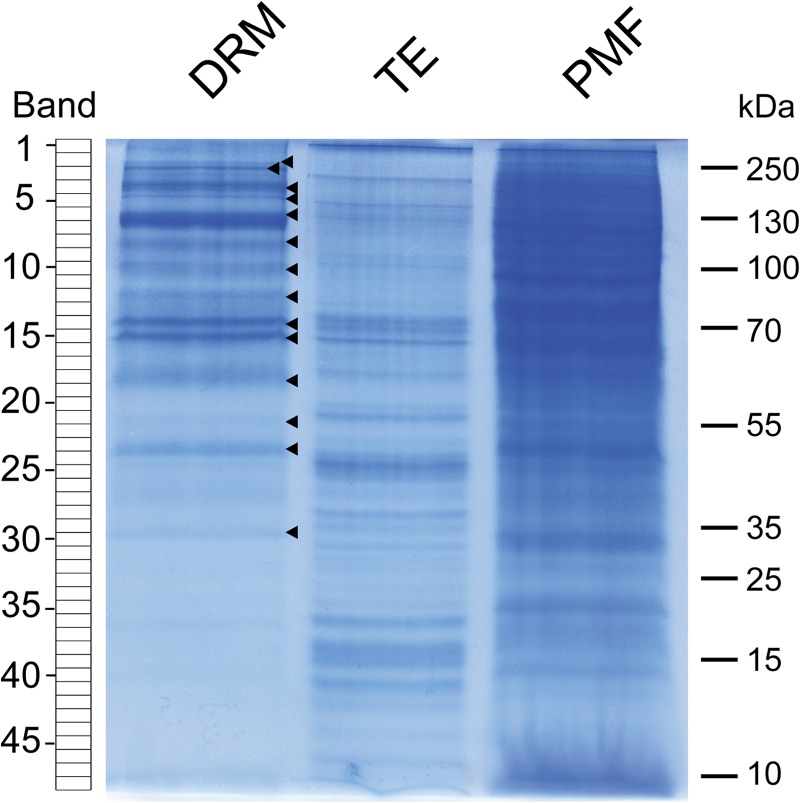
SDS-PAGE analysis of proteins present in detergent-resistant microdomains (DRM), Triton extract (TE), and plasma membrane fraction (PMF). A total of 20 μg of protein was loaded in each lane. Each lane of the Coomassie Blue–stained gel was cut into 48 bands as shown on the left-hand side of the picture. Arrowheads point to protein bands of a higher intensity in DRM relative to TE and PMF.