
Fig. 1.
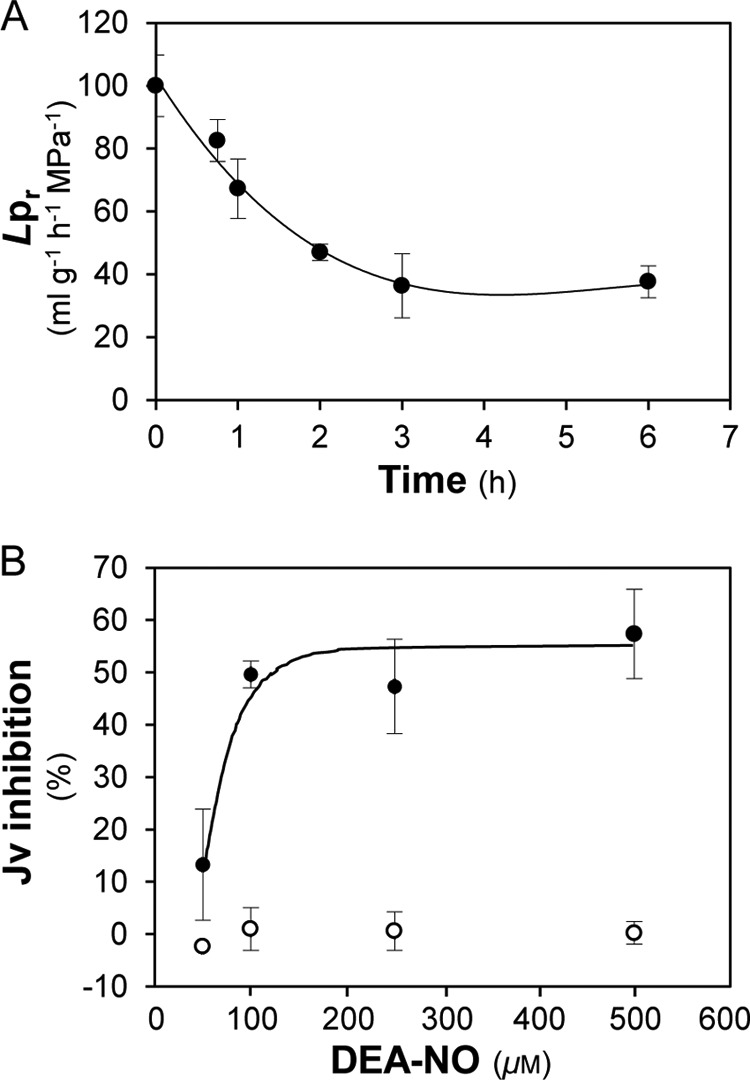
Effects of hyperosmotic (A) and oxidative (B) treatment on root water transport. A, Col-0 plants were transferred at time 0 in a nutrient solution complemented with 200 mm mannitol. The figure represents the kinetic changes of Lpr expressed as a percentage (±S.E.) of the initial Lpr (191.4 ± 18.9 ml g−1 h−1 MPa−1) and measured from n = 3 to 4 plants per culture with three independent cultures. B, Jv was determined after exposure for 10 min to increasing concentrations of DEA-NO (solid circles) or to the same solution deprived of DEA-NO (open circles). Data represent the average values from n = 3 to 4 plants per culture with three independent cultures.