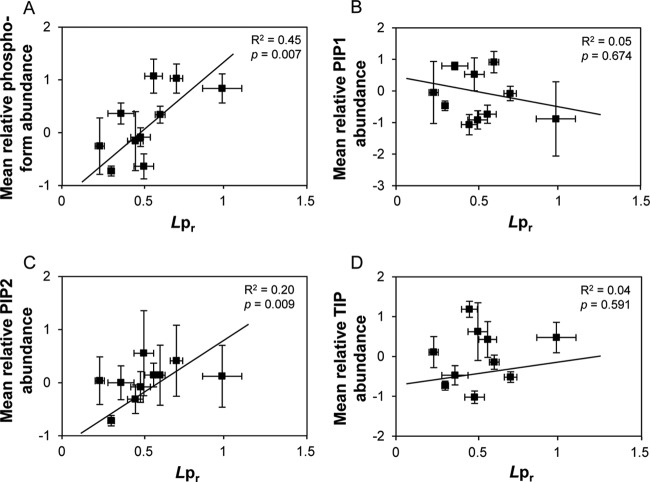
Fig. 5.
Relationship between Lpr and abundance of native and modified aquaporins. The mean relative abundance of phosphorylated PIP peptides (A) and of proteotypic peptides for PIP1s (B), PIP2s (C), and TIPs (D) was related to Lpr in NaCltmax, mantmax, H2O2tmax, NOtmax, dark, darksuc, darkman, Nstarv, Pstarv, and Presup conditions. All Lpr values were normalized with respect to Lpr in corresponding control conditions. A, phosphorylated PIP peptides are PIP11 12 (15–29) 1P, PIP21 (277–282) 1P, PIP21 (277–287) 1P, PIP21 (272–282) 1P, PIP21 (277–287) 2P1Dea, PIP27 (270–280) 1P, PIP27 (270–280) 1P 1Dea, PIP27 (270–280) 2P, and PIP27 (270–280) 2P 1Dea (see nomenclature in Table I). B, PIP1 proteotypic peptides are PIP12 (loop E), PIP13 (7–27), PIP14 (7–30), and PIP15 (7–30). C, PIP2 proteotypic peptides are PIP21 (17–33), PIP22 (15–32), PIP24 (H6) PIP27 (16–32), and PIP27 (loop C-H4). D, TIP proteotypic peptides are TIP11 (122–133), TIP11 (161–181), TIP11 (238–249), TIP12 (1–15), TIP12 (37–45), TIP12 (45–63), TIP12 (161–181), and TIP12 (235–239). Regression coefficients (R2) and p values are indicated.

