
Fig. 3.
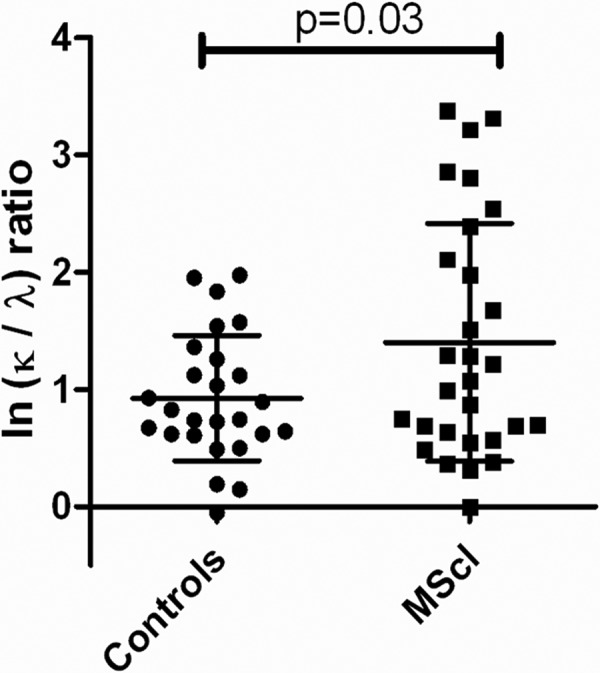
The κ-to-λ ratio in CSF Ig of MScl patients (n = 29) and controls (n = 26). The κ-to-λ ratio in CSF Ig of MScl patients and controls is expressed on a logarithmic (ln) scale and shown as the mean with S.D. Ratios showed elevation in the MScl group (unpaired t test, p = 0.03).