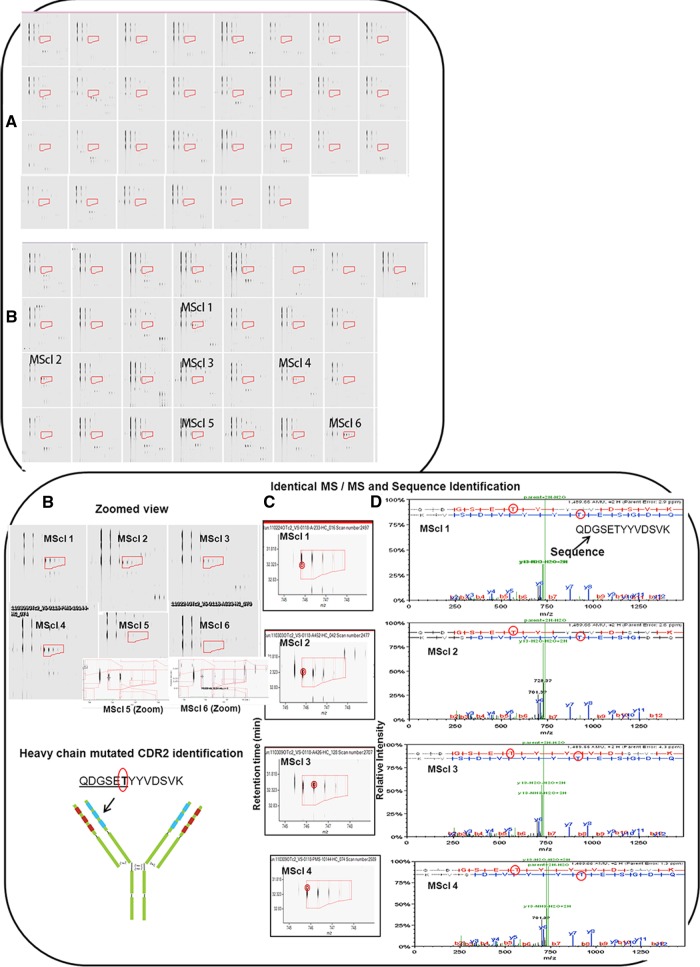
Fig. 4.
QDGSETYYVDSVK mutated CDR2 identification in six MScl patients and not in 30 controls. Peptides were analyzed by Progenesis LC–MS, and comparison between MScl and control groups was performed. After the chromatograms had been aligned in the Progenesis software, two-dimensional profiles were compared with find-expression profiles between the two groups. A, precursor mass of the peptide not found in any of the 30 controls. B, precursor mass of the peptide identified in six out of 29 MScl patients. The region covered in A and B by red boxes/isotope boundaries indicates the area of interest and shows the precursor mass isotopic pattern. The peptide abundance was calculated as the sum of the peak areas within these isotope boundaries. C, example of identical MS/MS fragmentation spectra in different MScl samples. Red circles (left) in the figure indicate the location of the retention time and the mass (m/z) where the MS/MS scan was triggered. Almost identical MS/MS fragmentation spectra were observed in different patients. D, MS/MS spectra containing the m/z values and abundances of peptide ion products. A longer series of contiguous y and b ions shows a higher probability of correct identification. The sequence proposes a mutated CDR2 peptide. Red circles show a mutated (T) amino acid from the germline that was found during alignment using the IMGT database.

