
Figure 2.
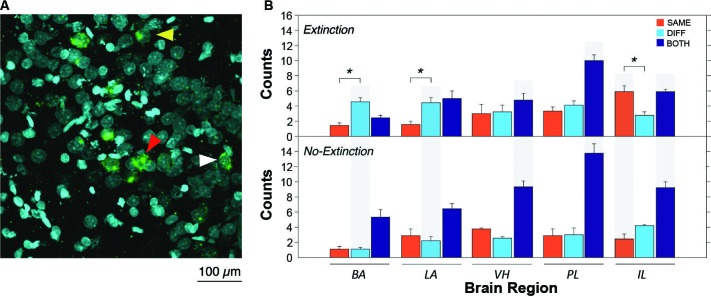
Representative catFISH staining and subsequent cell count results. (A) Representative confocal images VH taken at 40X magnification. White arrowheads indicate cytoplasmic staining and yellow arrowheads indicate nuclear staining. Red arrowheads indicate nuclear and cytoplasmic staining (non-selective neurons). (B) Raw counts of cells expressing Arc after in the extinction context (SAME), the renewal context (DIFF) or both contexts (BOTH). For the no-extinction group (NO-EXT), SAME and DIFF refer to the matched physical contexts in which the extinction group (EXT) was tested, because there was no SAME/DIFF relationship between the CS and test context in NO-EXT animals. Asterisks refer to significant within region differences in the number of neurons expressing Arc (p < 0.05). Gray shading indicates significant between group differences in Arc expression between EXT and NO-EXT groups (comparing top to bottom; p < 0.05). Cell counts are represented as means (±SEM) for the BA, LA, VH, prelimbic cortex (PL), and IL.