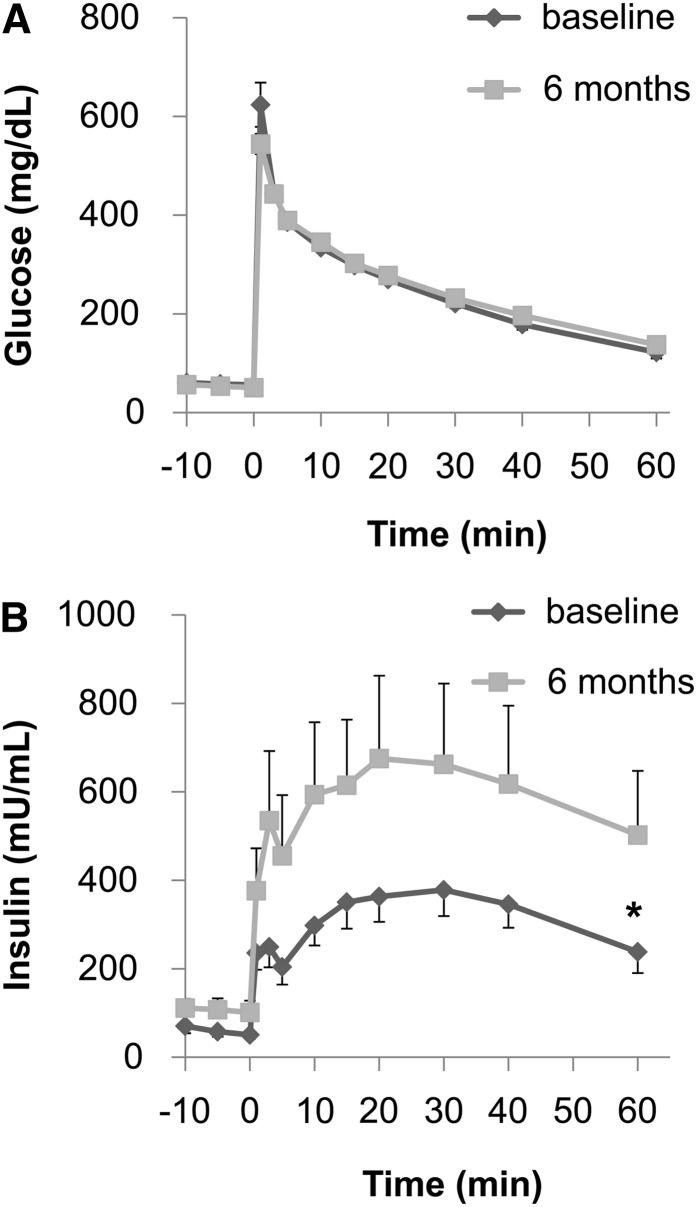
FIGURE 2.
Plasma glucose and insulin responses during an intravenous-glucose-tolerance test (IVGTT) in control monkeys at baseline and after 6 mo. The plasma glucose response (A) did not differ between the 2 time points. However, the plasma insulin response (B) during the IVGTT was significantly increased after 6 mo consuming fructose. Values are means ± SEMs; n = 9. *Different AUC from baseline, P ≤ 0.05.

