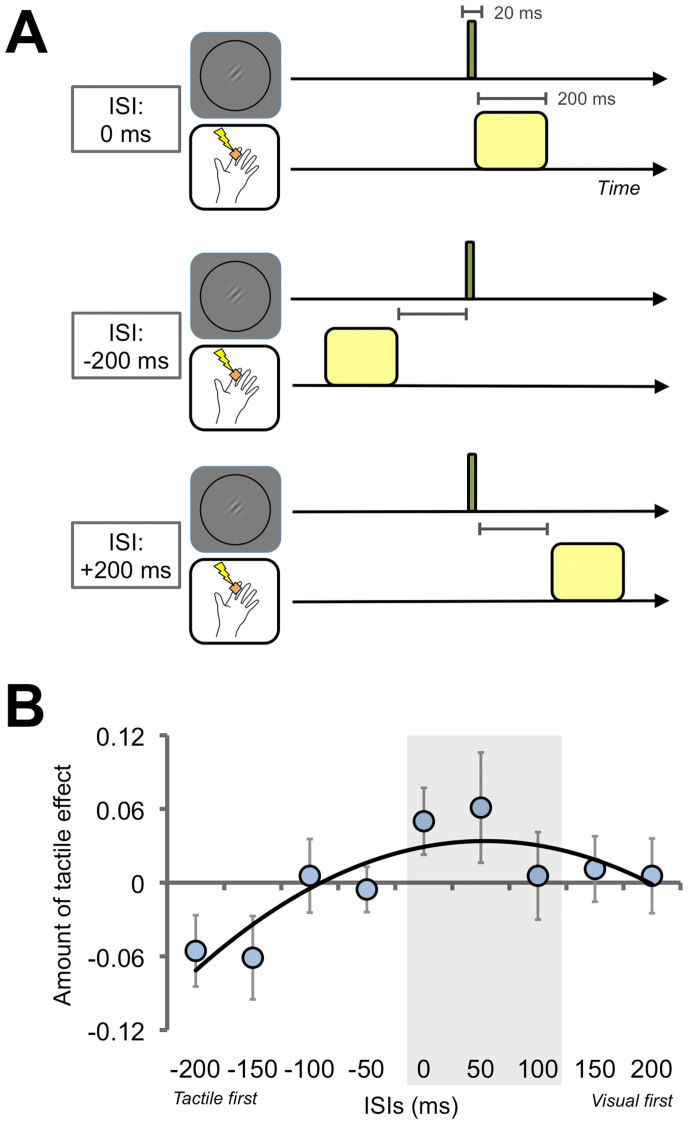
Figure 4. Effects of temporal distance between visual and tactile stimuli (Exp. 4).
(A) Schematic illustrations of the inter-stimulus interval (ISI) between the visual and tactile stimuli. ISIs were assigned from −250 ms (tactile stimulus first) to +250 ms (visual stimulus first) in 50-ms steps. (B) Results. After calculating the amount of tactile effect in each ISI based on proportions of correct responses for visual discrimination, we estimated peak values of ISI functions in each participant's data using a least squares method. The average peak is 53.85 ms and the 95% confidence interval ranges from −15.49 ms to 123.19 ms (gray shaded area). A black curved line indicates a fitted quadratic function to the averaged data (R2 = .74). Illustrations produced by and used with permission from Shoko Yabuki.

