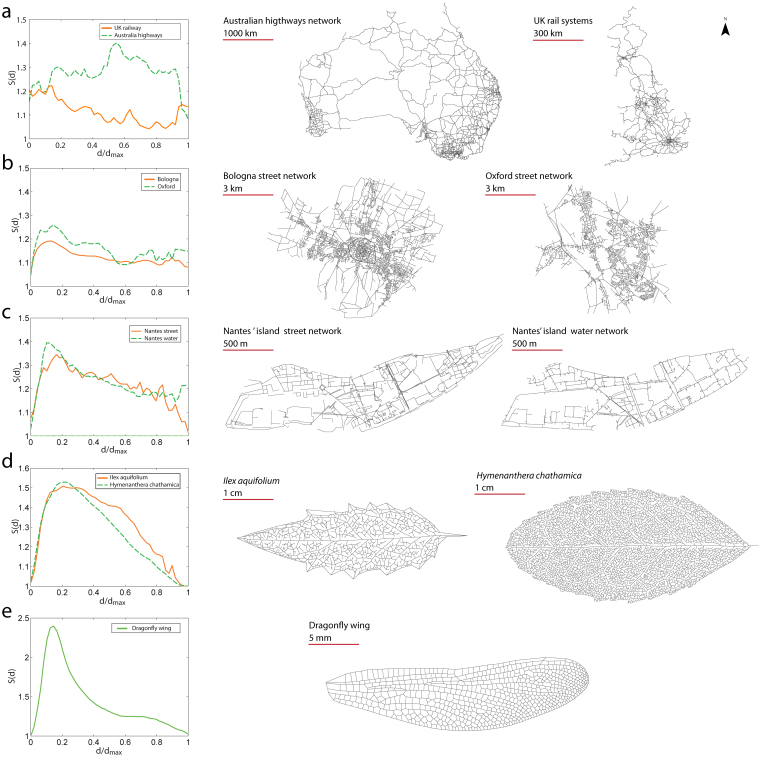
Figure 2. Simplicity profiles.
We represent here the simplicity profiles for different networks ranging from large scale networks (106 m) to small scales of order 10−3 m. We see on these different examples the effect of the presence of long straight lines and of a polycentric structure. In particular for cases (d,e), we can clearly see that the peak at d* ~ 0.2dmax corresponds to the size of domains not crossed by long straight lines. The figure was created using ESRI ArchMap 10.1 and Adobe Illustrator.

