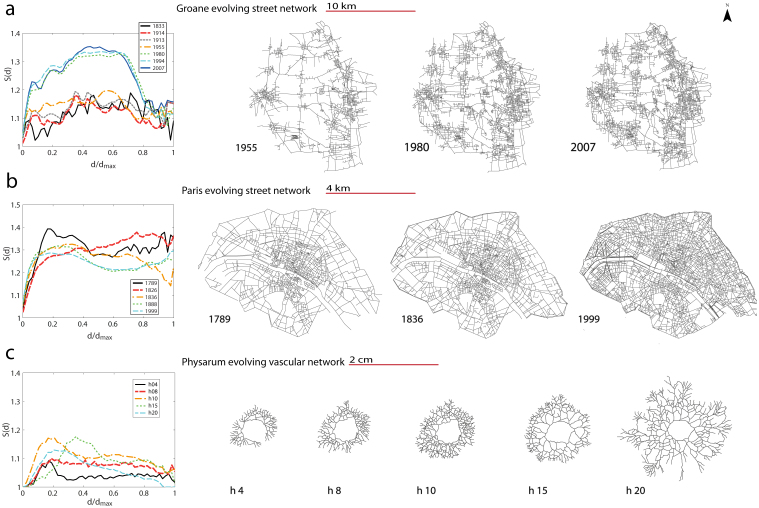
Figure 3. Simplicity profiles for time-varying networks.
We represent here the profiles for (a) the road network of the Groane region (Italy), (b) the street network of Paris (France) in the pre-Haussmannian (1789, 1836) and post-Haussmannian (1999) periods, and in (c) the Physarum network growing on a period of one day approximately. We observe on (a) and (b) that the evolution of the profile is able to reveal important structural changes. In (c) the evolution follows closely the one obtained with the null model (see SI). The figure was created using ESRI ArchMap 10.1 and Adobe Illustrator.

