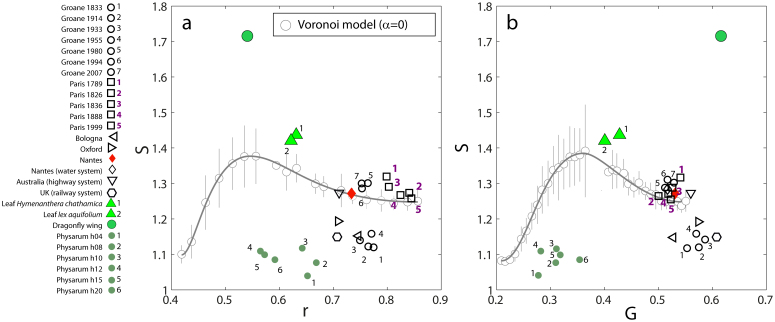
Figure 4. Simplicity index.
Simplicity versus (a) the density of straight line ρ and (b) the Gini coefficient for the length of straight lines. In both plots, the symbols correspond to the different networks studied here. We also represented the result for the null model (for α = 0) and its cubic spline interpolation (continuous line). From (a) we see that biological networks are limited to the region ρ ≤ 0.7 and have a large simplicity index, and from (b) we see that urban networks have simultaneously higher values of G and relatively small values of S.

