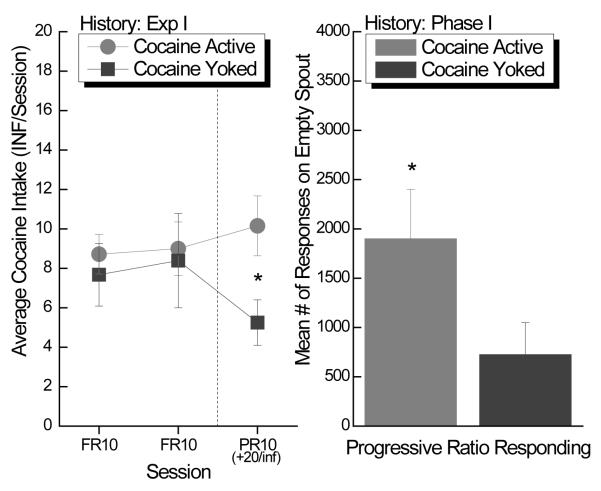
Figure 4.
Left Panel: Mean (± SEM) active cocaine intake (0.33 mg/inf) on a fixed (left of dashed line) and progressive (right of dashed line) schedule of reinforcement for rats with a history of either active or yoked cocaine in Experiment 1. Right Panel: Mean (± SEM) number of total contacts with the active empty spout on the progressive ratio day for the rats with a history of either active or yoked cocaine in Experiment 1.

