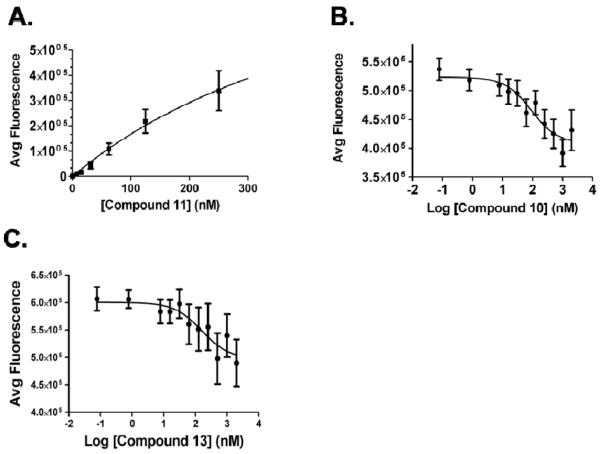
Figure 2.
Mean binding analysis curves generated by in cyto TRF binding assays. A) Saturation binding curve shows the specific binding (total – nonspecific) curve of Eu-DTPA-labeled compound 11 to TLR2 using HEK-293/hTLR2 cells with a Kd of 34 nM and Bmax of 114,271 AFU (n = 3 assays, R2 values > 0.97). Competition binding analysis, in which increasing concentrations of test compound were added in the presence of 90 nM 11 using HEK-293/hTLR2 cells. B) Compound 10 has a Ki of 25 nM (n = 5 assays, R2 = 0.90). C) Compound 13 has a Ki of 11 nM (n = 4 assays, R2 = 0.87).

