Figure 11.
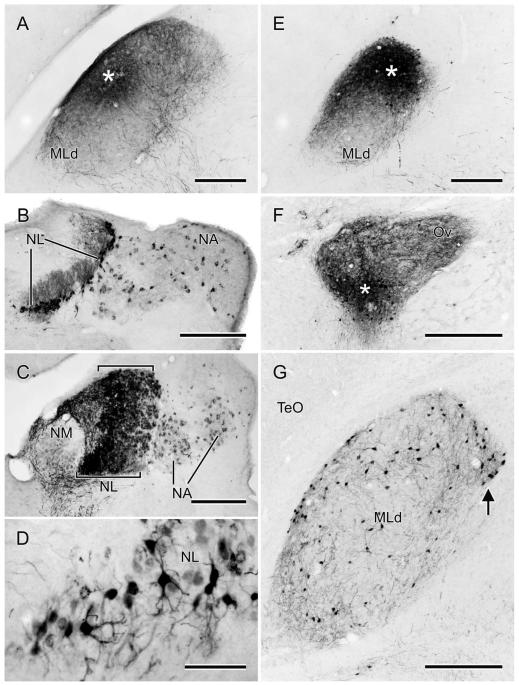
A,E: Photomicrographs of the MLd injections of CTB (A) or BDA (E) (asterisks depict the injection centers) that produced the retrogradely labeled cells in NA and NL depicted in Fig. 10A,E, respectively. B: Retrogradely labeled cells in the right NL and medial and lateral parts of NA, resulting from the injection shown in Fig. 10C. Note the labeling of NL dendrites, particularly on the medial (internal) aspect of the nucleus at this level. C: Retrogradely labeled cell bodies in NL and medial and lateral NA, resulting from the injection of CTB depicted in Fig. 10D. Note the width of NL at this level (between brackets). D: Retrogradely labeled cells in NL resulting from the injection of BDA shown in Figs. 10E and 11E. F: An iontophoretic injection of BDA in the ventral part of the left Ov, asterisk marks its center. G: Retrogradely labeled cells in the ipsilateral MLd resulting from the injection in F. Note the cluster of labeled cells at the ventromedial corner of the nucleus (arrow); see text for normal anatomy of MLd. Scale bars = 250 μm for A–C,E; 75 μm for D; 500 μm for F; 350 μm for G.

