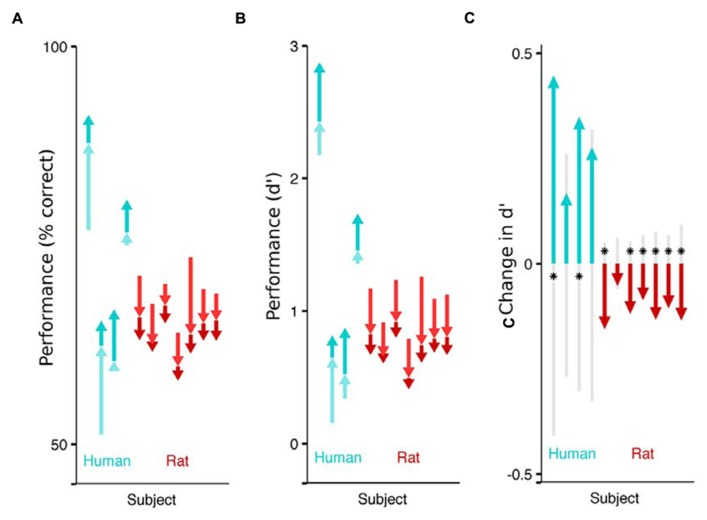
FIGURE 2.
Impact of flanking stimuli on the performance of humans and rats detecting a faint visual target. Each arrow indicates the difference in fraction of correct trails across stimulus categories, for a single subject (cyan for humans, red for rats). The pale arrow denotes the impact of non-collinear flankers with respect to no flankers. The darker arrow indicates the additional impact of collinear flankers, above and beyond the effect of non-collinear flankers. The sum of the two arrows captures the difference in performance between detecting targets without any flankers, and detecting targets in the presence of collinear flankers. The absolute performance on each of the three stimulus conditions (collinear, non-collinear, no flank) is captured by the tip and the base of the arrows. (A) Effect of flankers on performance (% correct). Humans performed better on trials with collinear flanking stimuli (upwards arrows) and rats performed worse on the trials with collinear flanking stimuli (downwards arrows). (B) Effect of flankers on sensitivity (d’). (C) Each subject’s sensitivity on the collinear trials minus their sensitivity on the non-collinear trials. The gray shaded region indicates chance differences within the range spanned by 95% of 10,000 random permutations of the subject’s response with respect to the stimulus. If performance for a given subject is significant beyond this chance range, it is marked with an asterisk.

