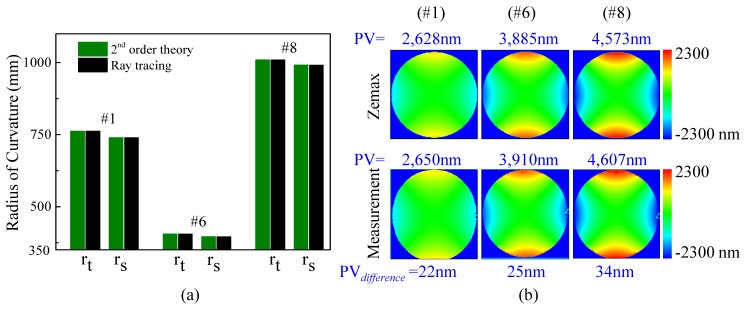
Fig. 9.

Comparison of surface shape for the three toroidal mirrors (#1, #6, and #8) fabricated for the AO-OCT system. (a) Radii of curvature of the three toroids were determined from ray trace modeling and compared to that predicted by 2nd order theory. (b) Ray trace and measured surface maps are compared for the three fabricated toroidal mirrors. Surface elevation is coded on a color scale. PV is the peak-to-valley surface elevation; PVdifference is the difference in PV between design and measurement.
