
Fig. 2.
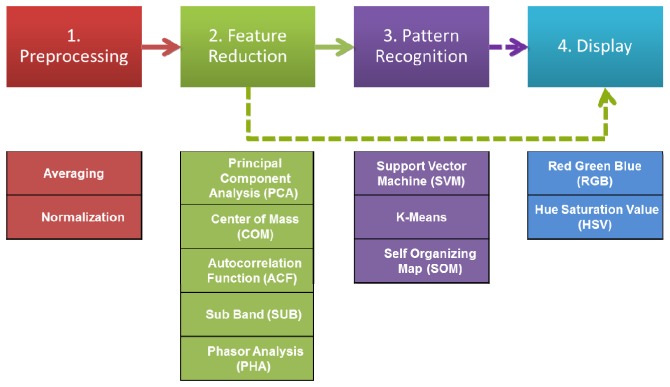
Signal processing steps to calculate the spectroscopic metric and display the data split into four blocks: (1) preprocessing that includes normalization and averaging of the data. (2) Feature reduction, which contains one of the following methods: Phasor Analysis (PHA), Center of Mass (COM), Autocorrelation Function (ACF), Principal Component Analysis (PCA) or Sub Band (SUB). (3) Pattern recognition, an optional step, which consists of one of the following methods K-Means clustering, Self Organizing Map (SOM) or Support Vector Machine (SVM). (4) Displaying the results from the different methods in a color map using the RGB or HSV color model. Alternatively the output of the feature reduction method can be displayed directly, without applying pattern recognition, using an appropriate color map.