
Fig. 5.
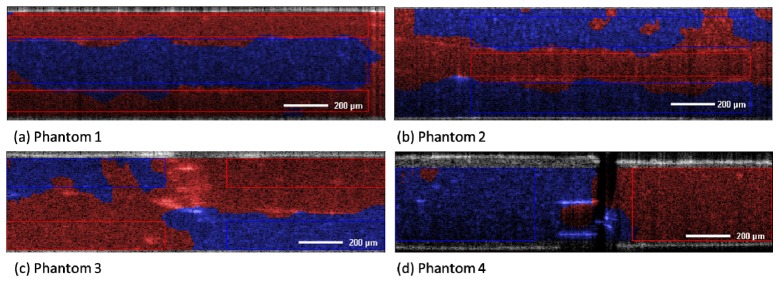
S-OCT analysis by PCA and K-Means clustering of phantoms 1-4. Blue staining indicates 1µm microspheres, red staining 3µm microspheres. Rectangles indicate areas which were chosen for accuracy calculation. Bar indicates 200 µm.
Official websites use .gov
A
.gov website belongs to an official
government organization in the United States.
Secure .gov websites use HTTPS
A lock (
) or https:// means you've safely
connected to the .gov website. Share sensitive
information only on official, secure websites.
S-OCT analysis by PCA and K-Means clustering of phantoms 1-4. Blue staining indicates 1µm microspheres, red staining 3µm microspheres. Rectangles indicate areas which were chosen for accuracy calculation. Bar indicates 200 µm.