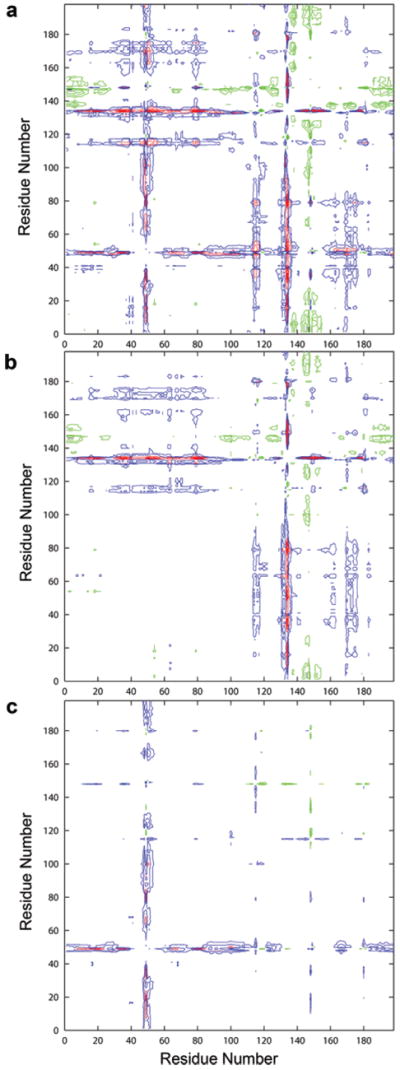
Figure 4.

Double difference plots showing the relative shifts in the wild-type HIV-1 protease complexes of (a) 13e in reference to LPV, (b) 14a in reference to LPV, and (c) 14a in reference to 13e. Double difference plots contour differences in internal Cα–Cα distances between two complexes. Contours in the plots show whether the respective distances in the two complexes being compared are closer or further apart. Black indicates a difference of < −1 Å, green indicates a difference of between −0.99 and −0.5 Å, blue indicates a difference of between 0.5 and 0.99 Å, and red indicates a difference of > 1 Å.
