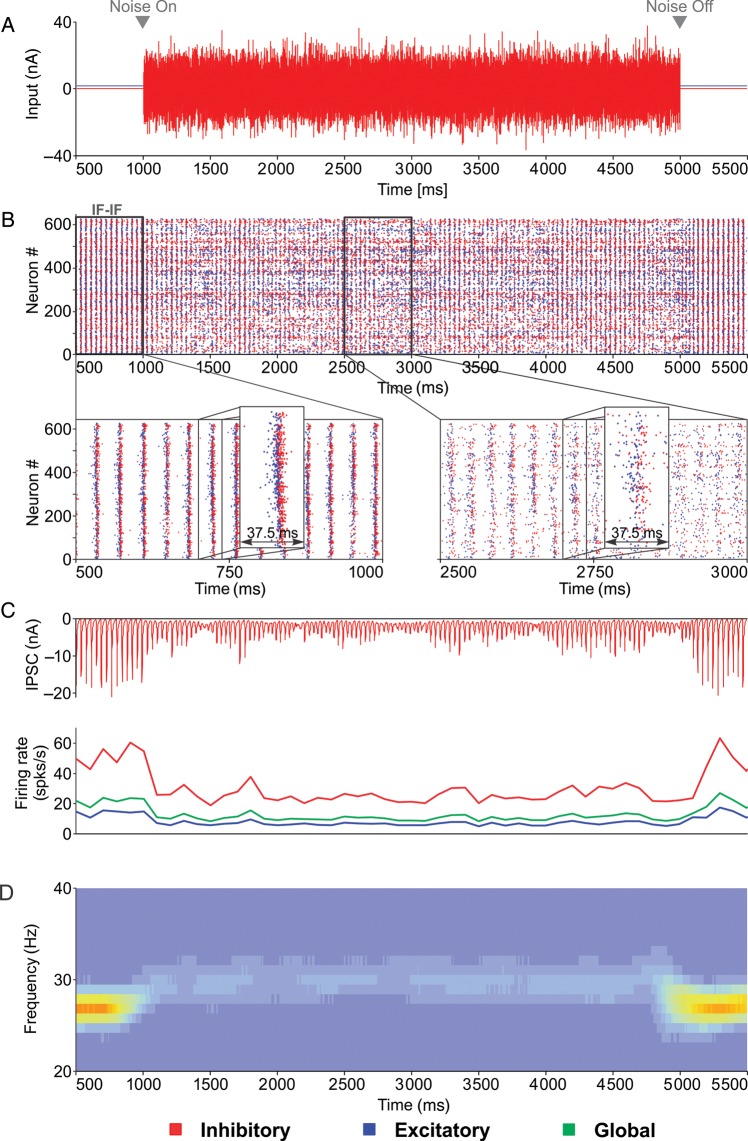
Figure 6.
Relationship between interneuron synchronization and oscillation frequency studied in a simplified IF–IF setup. (A) Inputs were delivered as constant currents. Between t = 1000 and t = 5000 ms, a Gaussian noise with zero mean and SD = 9 nA was in addition delivered to interneurons in order to desynchronize them. (B) A single trial of an IF–IF network with insets showing a portion of stronger (left) and poorer (right) synchronization. (C) Average IPSC across the network and time-resolved firing rates (100 ms window) corresponding to the trial in (B). (D) Average time-resolved power spectrum computed over 20 trials.

