
Fig. 5.
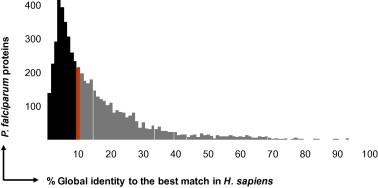
Parasite vs. host. Frequency distribution of percent global identity to H. sapiens in the P. falciparum proteome. The red bar marks the median, the gray areas the P. falciparum proteins that were excluded from the potential target space.
Official websites use .gov
A
.gov website belongs to an official
government organization in the United States.
Secure .gov websites use HTTPS
A lock (
) or https:// means you've safely
connected to the .gov website. Share sensitive
information only on official, secure websites.
Parasite vs. host. Frequency distribution of percent global identity to H. sapiens in the P. falciparum proteome. The red bar marks the median, the gray areas the P. falciparum proteins that were excluded from the potential target space.