
Figure 1. Regions of correlation between rGMV and EFT score.
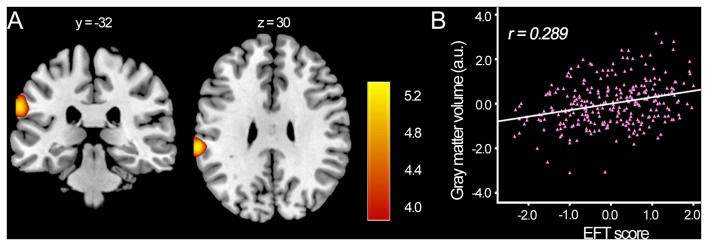
(p < 0.05, corrected for FDR).
(A) The left IPL in which variability in rGMV exhibited significant positive correlation with EFT score (n=286) is superimposed on a standard T1-weighted template brain in MNI stereotactic space. (B) A scatterplot between left IPL volume and EFT score adjusted for age, gender, and total gray matter volume is shown for illustration purpose only.