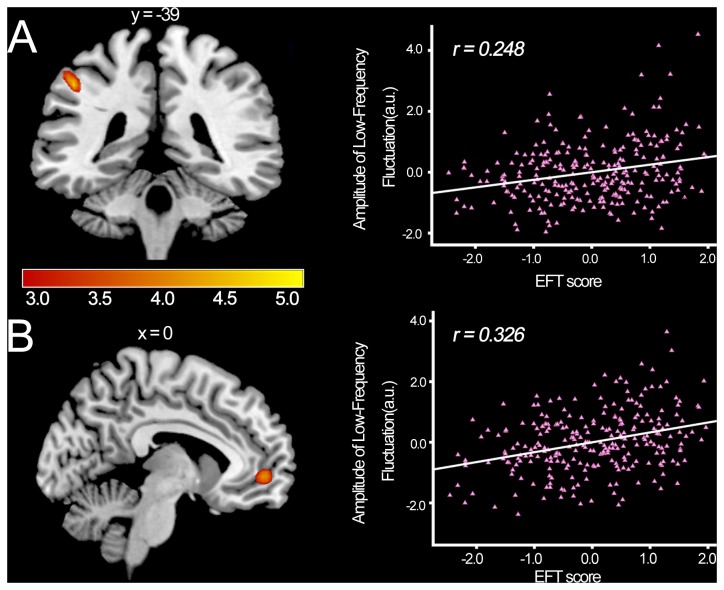
Figure 2. ALFF was positively correlated with individual EFT score.
In the left panel, results are shown with p < 0.0005 uncorrected for visualization purposes. (A) Coronal view. Regions of significant correlation are shown in the left IPL; (B) Sagittal view. Regions of significant correlation are shown in the mPFC. The right panel shows corresponding scatterplots of the relationship between the EFT score and ALFF values of the significant cluster in the region of the left panel. The scatterplots adjusted for age, gender, CRT score are shown for illustration purpose only.

