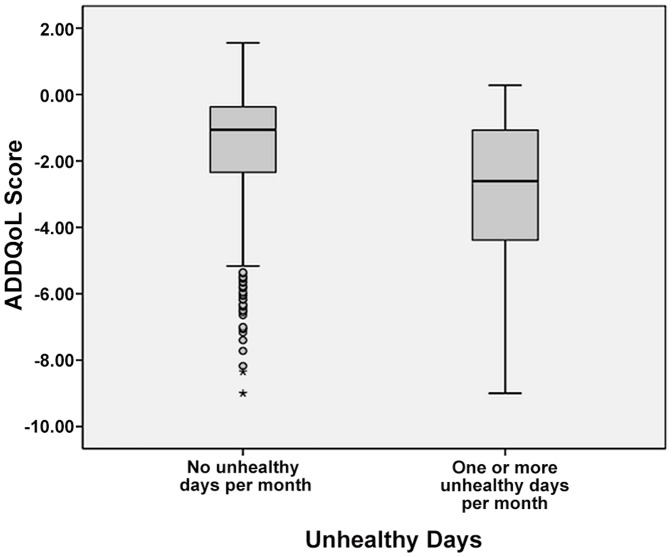
Figure 1. Distribution of ADDQoL score by unhealthy days groups.
Figure 1 shows the variability of the ADDQoL score within the dichotomised unhealthy day's groups. While the distribution of the ADDQoL scores was shifted to lower levels in those with one or more unhealthy days relative to those with none, there was significant overlap between the two groups.

