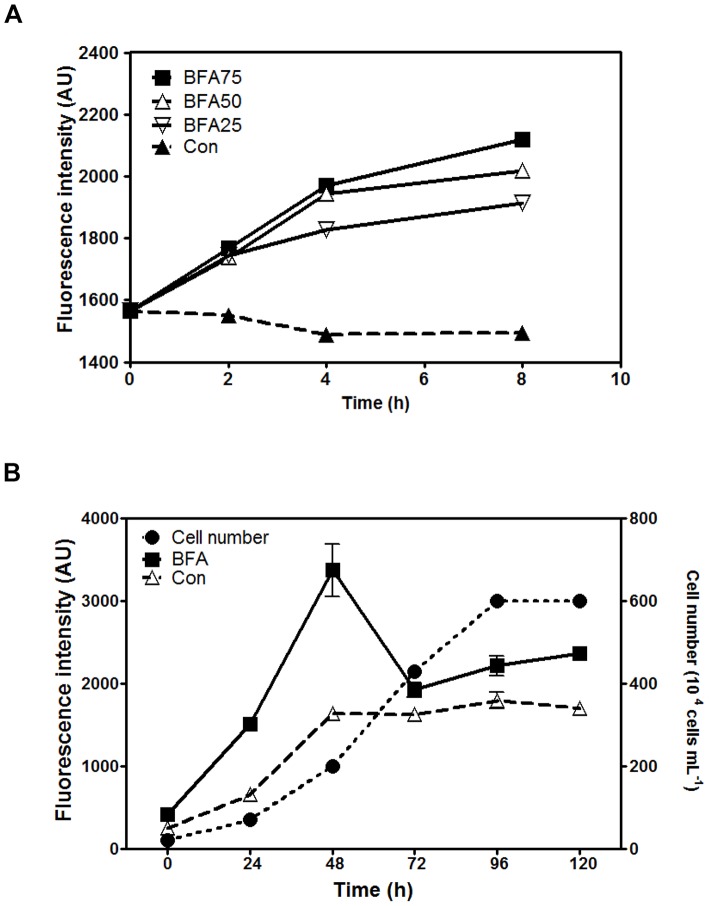
Figure 2. Dose-dependence and growth phase-dependence of the effect of BFA treatment on LD formation in Chlamydomonas reinhardtii CC-503.
(A) Fluorescence intensity of LDs stained with Nile red in cells treated with different BFA concentrations (25, 50, and 75 µg mL−1) for the indicated durations. (B) Nile red fluorescence intensity of LDs in cells treated at different stages of cell culture with either 75 µg mL−1 BFA (closed squares) or DMSO (solvent control, Con; open triangles). Cells were grown in normal TAP medium, and at 24-h intervals, the number of cells in culture (closed circles) was analyzed using a hemocytometer, and the 8-h treatment with BFA was started. AU = arbitrary units.

