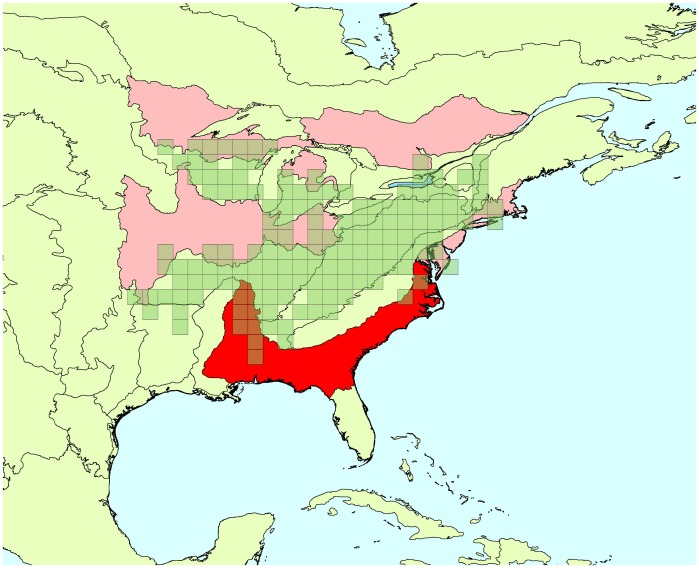
Figure 2. Cerulean warbler’s range and BCRs where trend estimates were improved by spatial approach.
Green squares: cells where the species has been detected at least once between 1966 and 2009. Red areas: Bird Conservation Regions where trend estimates’ credible intervals were more precise due to the use of a spatial approach, compared to the current BBS analysis. Bright red indicates the BCRs where the improvement in precision is the greatest.

