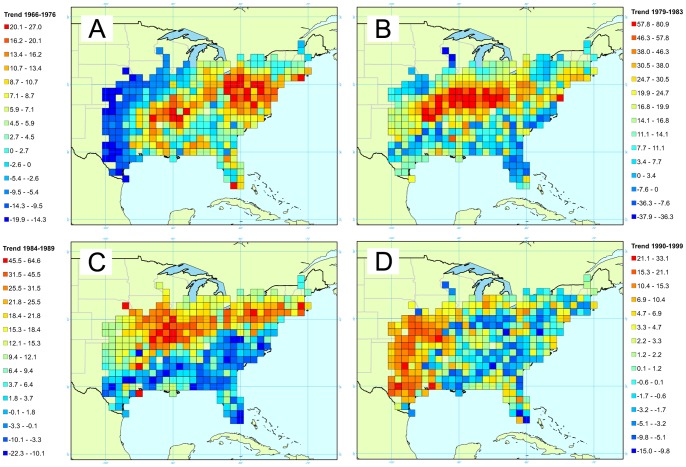
Figure 4. Map of the trends for the Carolina wren.
Four times intervals are presented corresponding to yearly trends between A/1966 and 1976, B/1979 and 1983, C/1984 and 1989, and D/1990 and 1999. Trend is expressed as a percentage reflecting the yearly variation of abundance during the corresponding period.

