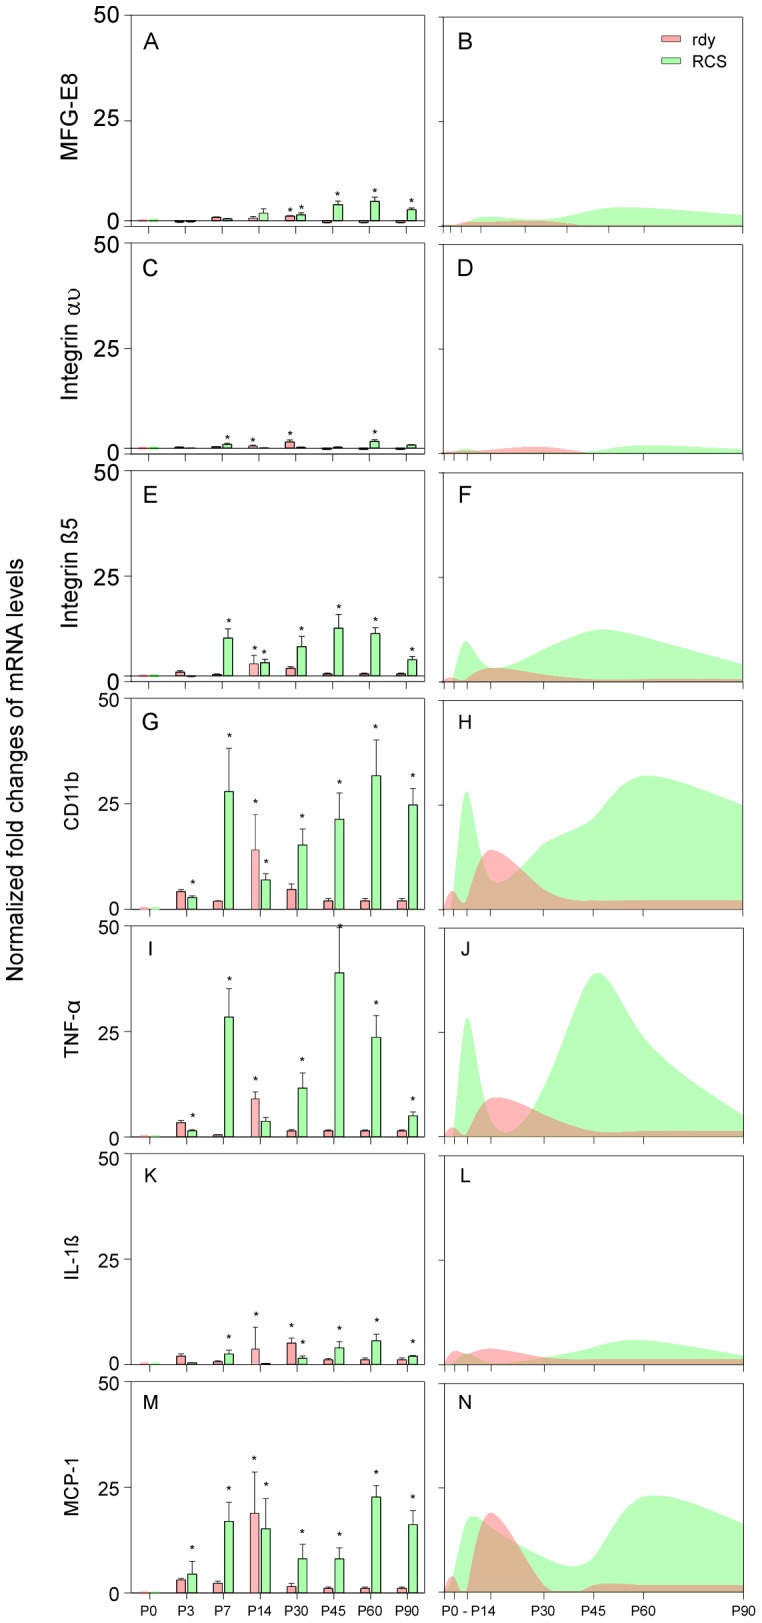
Figure 3. The mRNA expression of MFG-E8 and its integrins (αυ and ß5) and inflammatory factors in retinas of RCS and rdy rats.

(A–N) all of the gene expression of RCS rats formed a bimodal peak pattern centred at P14 and P45 to P60 but formed a unimodal pattern centred at P14 in rdy rats. The mRNA levels of MFG-E8, integrin αυ and IL-1β were relatively lower than the others in both rats, although the expression of integrin β5, CD11b, TNF-α and MCP-1 were quite high in the two rats, especially in RCS rats (E–J and M–N). *P<0.05.
