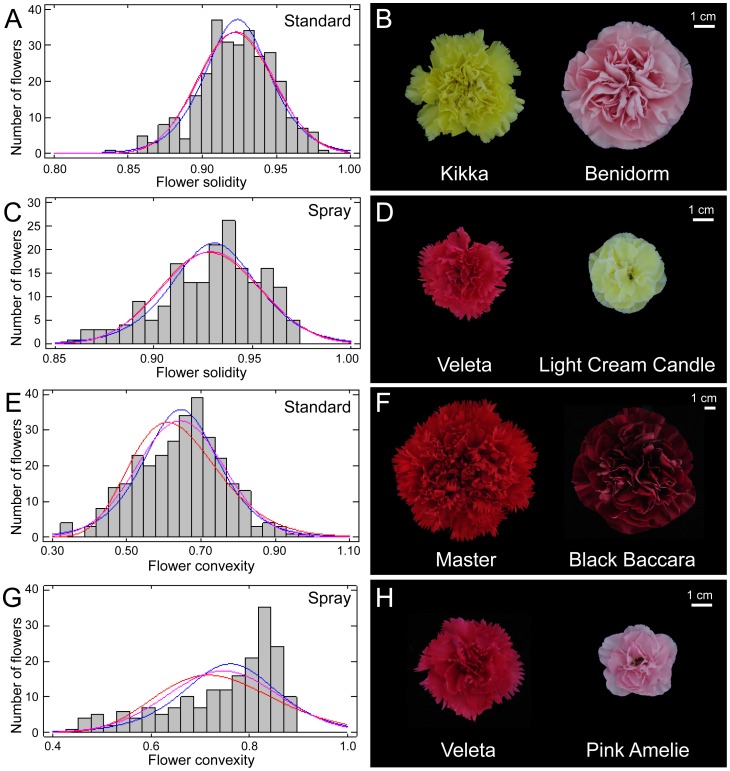
Figure 3. Flower evenness among carnation cultivars.
(A, C) Histograms for the flower solidity dataset with overlay of theoretical distributions (blue, normal distribution; red, log-normal distribution; pink, logistic distribution) in standard (A) and spray (C) cultivars. (B, D) Representative photographs of flowers with extreme values for solidity in standard (B) and spray (D) cultivars. (E, G) Histograms for the flower convexity dataset with overlay of theoretical distributions (blue, normal distribution; red, log-normal distribution; pink, logistic distribution) in standard (E) and spray (G) cultivars. (F, H) Representative photographs of flowers with extreme values for convexity in standard (F) and spray (H) cultivars. Flower photographs were obtained and analyzed as described in Materials and methods.

