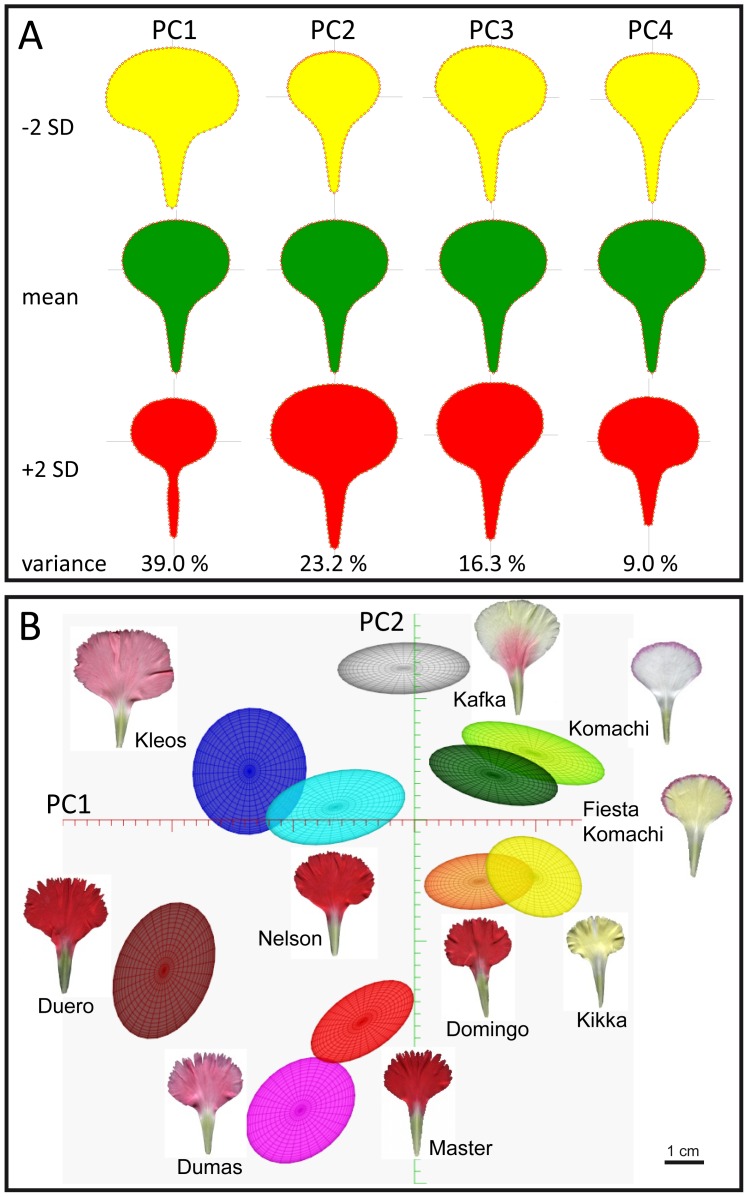
Figure 7. Principal component (PC) analysis of petal morphometry in standard carnation cultivars.
(A) Petal shape by variation along the first four PCs of the carnation petal shape model, PC1 to PC4. The mean petal and petal shapes corresponding to PC values deviating by ±2 SD are shown. (B) Two-dimensional PC map generated by standard deviations from the mean petal along PC1 and PC2. The ellipses represent 1 SD from the mean petal for each one of the nodes (cultivars) shown.

