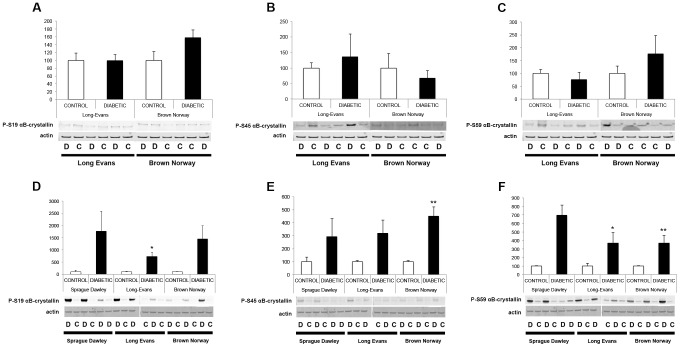
Figure 6. Phosphorylation analysis of alphaB-crystallin during diabetes.
The expression of alphaB-crystallin protein phosphorylated at serines 19 (A, D), 45 (B, E) and 59 (C, F) were assessed by Western blot analysis using specific antibodies raised against alphaB-crystallin protein phosphorylated at those sites 4 weeks after the onset of diabetes (A–C) in Long Evans (LE) and Brown Norway (BN) rats. Expression levels were also assessed at 12 weeks (D–F) in Sprague Dawley (SD), in Long Evans (LE) and Brown Norway (BN) rats. Representative immunoblots and graphic representation of the corresponding quantification of the major bands are presented. C, control; D, diabetic. *Significantly different from control [P<0.05].

