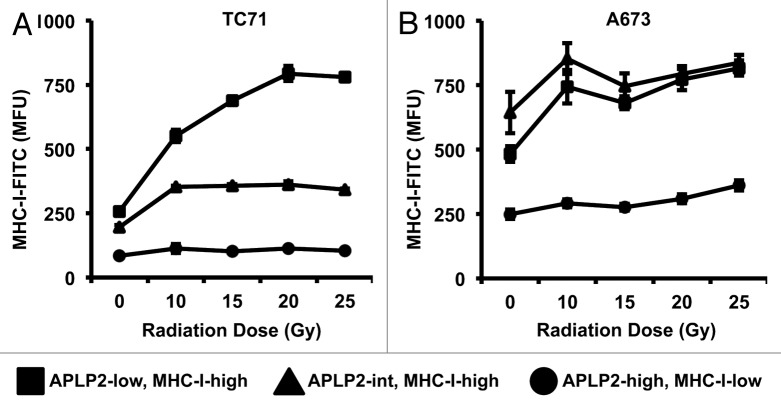
Figure 3. The APLP2high phenotype identifies EWS cells with consistently relatively low MHC class I surface expression upon irradiation. (A-B) EWS cells exposed to the indicated doses of γ rays were examined by flow cytometry for the co-expression of APLP2 and folded MHC class I molecules (using the W6/32 antibody) on their surface. Three cell subpopulations were identified: APLP2highMHCIlow, APLP2intMHCIhigh, and APLP2lowMHCIhigh cells. MHC class I-dependent fluorescence (in terms of mean fluorescence units, MFU) is depicted for each subpopulation of TC71 (A) and A673 (B) cells. Error bars denote SD (n = 6 experimental replicates within 1 representative experiment out of 3 independent ones performed that yielded similar results, with 1 experiment including both TC71 and A673, and 2 experiments including 1 of the 2 cell lines). Representative dot plots can be found in Figure S3.

An official website of the United States government
Here's how you know
Official websites use .gov
A
.gov website belongs to an official
government organization in the United States.
Secure .gov websites use HTTPS
A lock (
) or https:// means you've safely
connected to the .gov website. Share sensitive
information only on official, secure websites.
