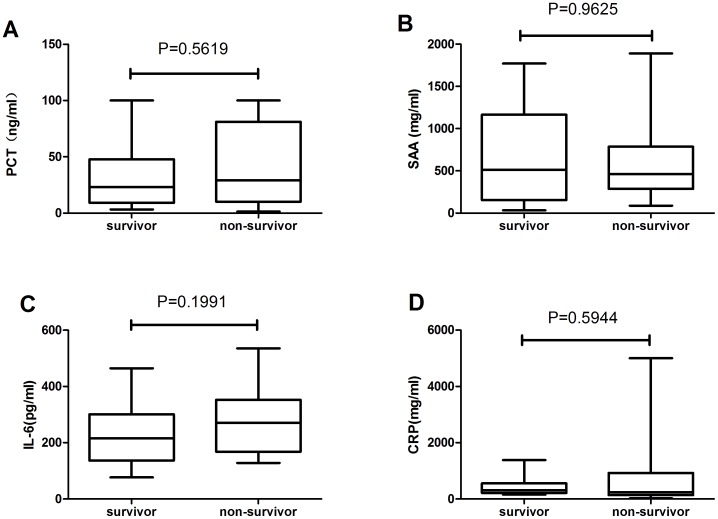
Figure 5. Initial levels of infective markers between AKI survivors and non-survivors.
The boxes indicate the interquartile range (IQR). The dark lines denote the median. The whiskers indicate minimum and maximum values. Marker levels were compared between the two groups using the Wilcoxon rank sum test.

