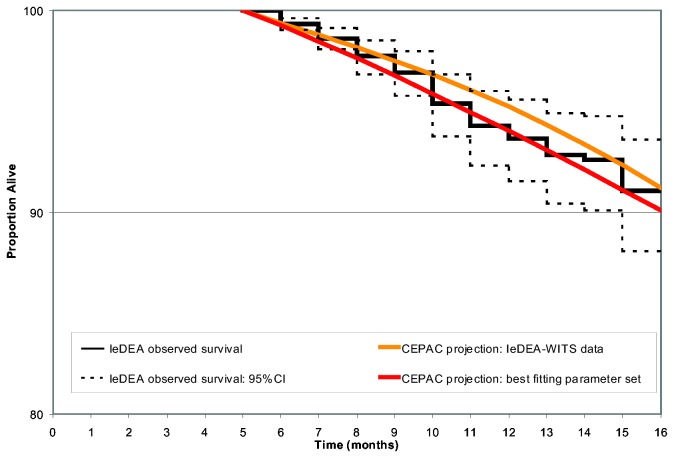
Figure 2. Internal validation of survival outcomes: Observed survival curves from the IeDEA East African region and projected results from the CEPAC-Pediatric Model.
The solid black stepped line represents observed survival in the IeDEA cohort based on Kaplan-Meier analysis, beginning at 5 months of age. Dashed black lines reflect the upper and lower bounds of the 95% confidence intervals for IeDEA-observed survival. The orange line shows CEPAC model-projected survival using the "IeDEA-WITS projection" data (RMSE = 0.0103). The best-fitting curve is shown with the red line, reflecting mean CD4% at birth of 45.0%, CD4% decline of 6.0%/month in infants <3 months of age, and 0.3%/month for children >3 months of age (RMSE = 0.00423).

