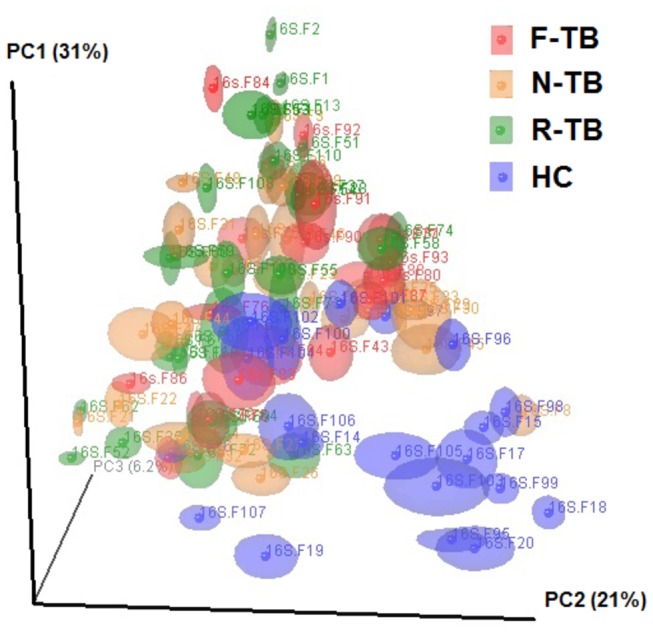
Figure 2. Principal Coordinates Analysis (PCoA) plot based on weighted UniFrac distance.

Samples of N-TB (orange), R-TB (Green), and F-TB (Red) are shown as dots in the plot. F-TB, treatment failure TB; N-TB, new TB; R-TB, recurrent TB; HC, healthy controls.
