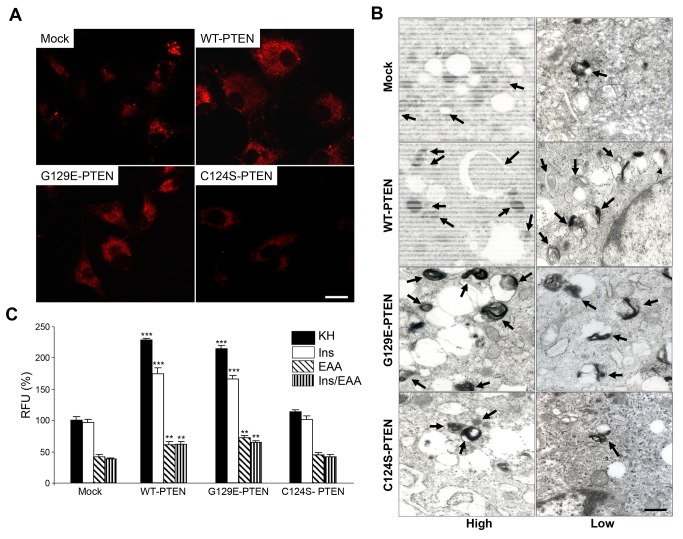
Figure 5. PTEN expression in U87MG cells increases the lysosomal mass.
A) Representative fluorescence images of cells expressing WT-PTEN, C124S-PTEN and G129E-PTEN and of the mock-treated U87MG cells (control) incubated under high proteolysis conditions for 2 h and with LysoTracker Red (75 nM) during the last 15 min. Fluorescence is higher in cells expressing WT-PTEN and G129E-PTEN. Bar: 20 μm. B) Representative electron micrographs of the cells incubated for 2 h under high and low proteolysis conditions. Cells that express WT-PTEN and the G129E-PTEN mutant show more autophagic vacuoles (arrows) compared to the mock-treated cells or the cells expressing the C124S-PTEN mutant. Bar: 0.6 μm. C) Cells were incubated as in A) but under high (KH), intermediate (KH plus insulin, Ins, or amino acids, EAA) and low (KH plus insulin and amino acids, Ins/EAA) proteolysis conditions (see Materials and Methods). LysoTracker Red fluorescence in the cells was analyzed by flow cytometry as described in Materials and Methods. Relative fluorescence units (RFU) are expressed in percentage of the values obtained in the mock-treated U87MG cells incubated under high proteolysis conditions (KH). Results are the mean ± SD from seven independent experiments with duplicate samples. Stars indicate statistically significant differences from the corresponding (high, intermediate and low proteolysis conditions) values in mock-treated cells at **p<0.01 and ***p<0.005.

