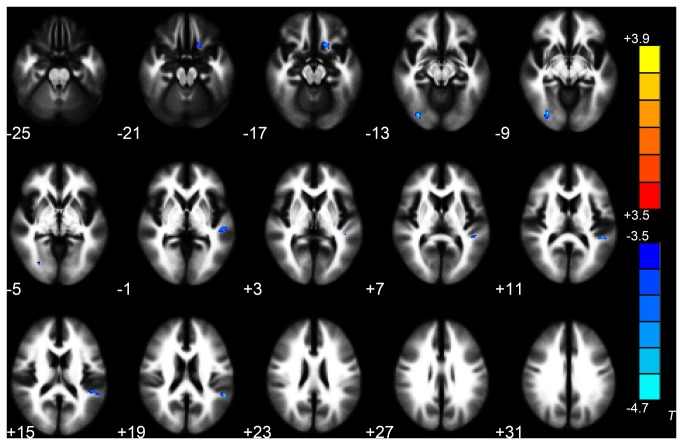
Figure 4. Significant differences in FA values between trauma-exposed victims with PTSD and healthy controls These clusters were shown in the WM of right inferior occipital gyrus, left superior temporal gyrus and left superior frontal gyrus, orbital part.
(2-sample t-test, P < 0.05, AlphaSim-corrected).
Cold colors indicate decreases in FA. The left part of the figure represents the participant’s right side.
PTSD = posttraumatic stress disorder; FA = fractional anisotropy; WM = white matter.

