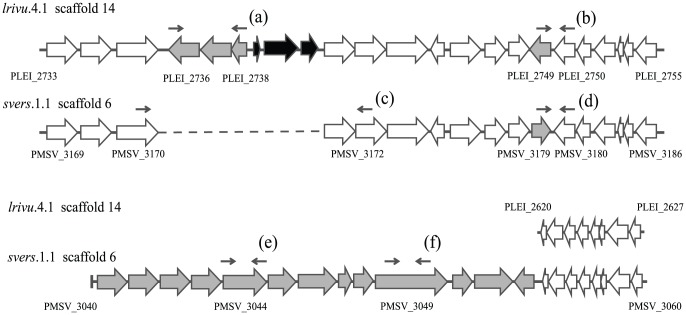
Figure 2. Comparison of exopolysaccharide biosynthesis genes in P. leiognathi lrivu.4.1 and ‘P. mandapamensis’ svers.1.1.
Large arrows represent CDSs predicted from the genome annotation, arrows direction indicate the direction of transcription. White arrows indicate orthologs found in both strains. Grey arrows represent strain-specific sequences predicted to take part in exopolysaccharide biosynthesis. Grey arrows on ‘P. mandapamensis’ svers.1.1 scaffold 6 indicate CDS with homology to genes of A. fischeri syp operon. Black arrows mark three CDSs specific to P. leiognathi lrivu.4.1 that have no predicted function in exopolysaccharide biosynthesis. Dotted line indicates a region absent in ‘P. mandapamensis’ svers.1.1, vertical line indicates end of the scaffold sequence. Small arrows indicate primers used in testing the genes incidence in P. leiognathi and ‘P. mandapamensis’. Letters in brackets correspond to those used in the Table 1.

