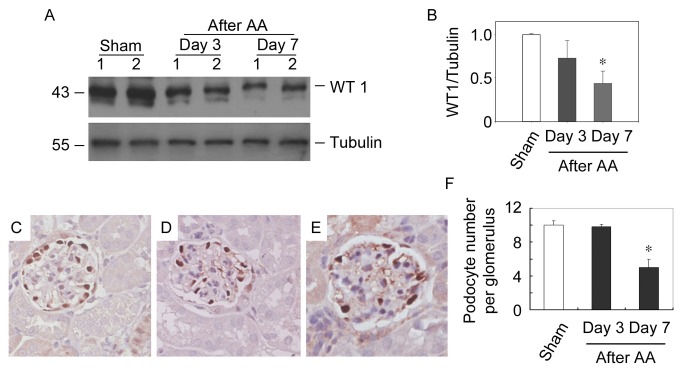
Figure 3. AA causes podocyte depletion in mice.
(A) Western blot analysis of WT1 expression levels in mice received AA. Whole kidney lysates were immunobloted with antibodies against WT1 and Tubulin, respectively. Samples from two individual animals per group were used. (B) Graphic presentation of relative WT1 abundance normalized to Tubulin. * P<0.05 versus sham (n = 3). (C-E) Representative micrographs show the podocyte abundance at sham (C), day 3 after AA (D) and day 7 after AA (E). Kidney sections were stained with antibodies against WT1. (magnification: ×400) (F) Quantitative determination of the glomerular podocyte numbers at different time points after AA administration. * P < 0.05 versus sham (n = 4).

