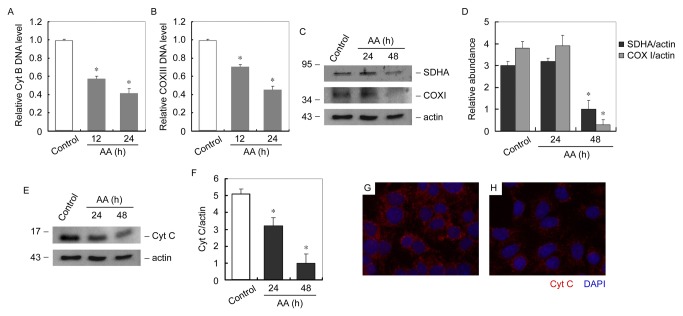
Figure 6. AA reduces mitochondria biogenesis in cultured podocytes.
(A and B) Q-PCR analysis of relative Cyt B (A) and COX III (B) DNA expression levels in podocytes at different time points after AA treatment. * P < 0.05 versus control (n = 3). (C) Western blot analysis of mitobiogenesis levels in podocytes at different time points of AA treatment. Whole cell lysates was immunobloted with antibody against mitobiogenesis western blot cocktail (SDHA, COX I and actin). (D) Graphic presentation of relative SDHA and COX I abundance normalized to actin. * P<0.05 versus control (n = 3). (E) Western blot analysis of Cyt C levels in podocytes at different time points of AA treatment. Whole cell lysates was immunobloted with antibody against Cyt C. (F) Graphic presentation of relative Cyt C abundance normalized to actin. * P<0.05 versus control (n = 3). (G and H) Representative micrographs show immunofluorescent staining of Cyt C (red) in control and 24h of AA treated podocytes. Nuclei were stained with DAPI (blue) (magnification: ×400).

