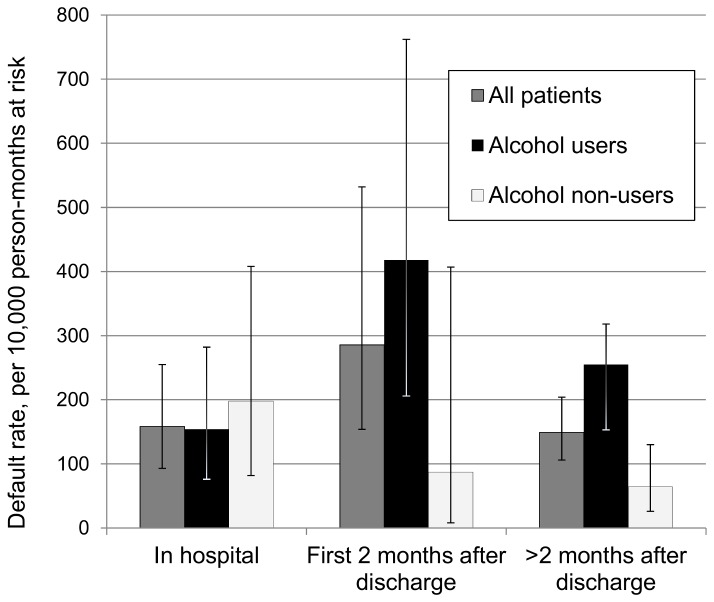
Figure 1. Default rates for patients on MDR-TB treatment, by time period and alcohol use status.
Default rates with 95% confidence intervals were calculated in each of three time periods defined relative to hospital discharge date. Rates are shown for all patients as well as stratified by reported history of recent alcohol use.

