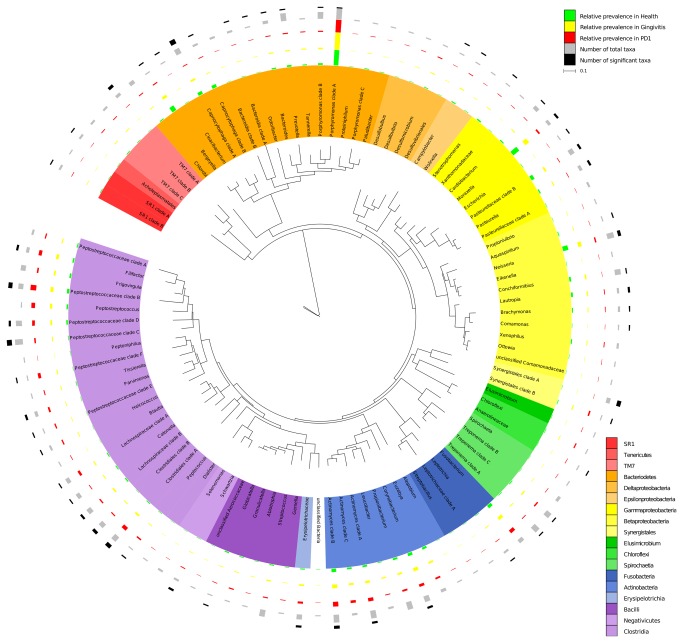
Figure 1. Circular maximum likelihood tree of full length 16S rRNA genes at level of genus.
The inner band shows genera coloured by phylum/class (based on NCBI taxonomy) , the next three bands depict relative abundance of each genus in health (green), gingivitis (orange) and mild periodontitis (red). The two outer bands show the total number of taxa identified within the genus (grey, ranging from 1 to 11) and number of those taxa that showed a significant association with a health status (black, ranging from 0 to 5).

