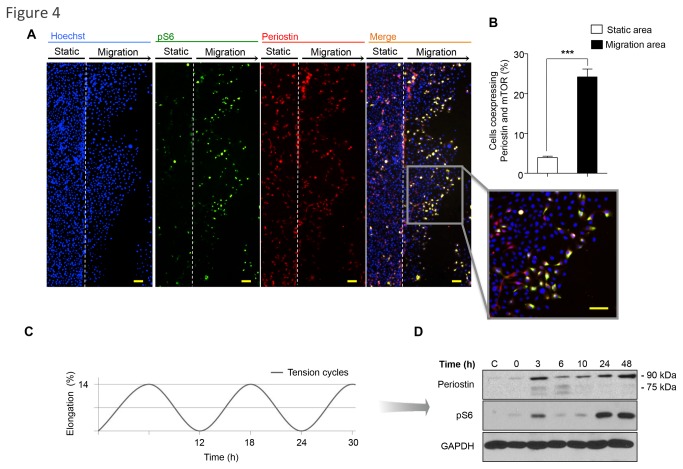
Figure 4. Co-expression of Periostin and mTOR during cellular migration and mechanical stress induced by tension.
(A) A representative wound healing scratch assay shows keratinocytes stained for Periostin (TRITC-red), pS6 (FITC-green) and DNA (Hoechst-blue). Note colocalization of Periostin and pS6 staining (on merge and insert) in the migratory area. Scale bars represent 50 μm. (B) Quantification of positive cells co-expressing Periostin and pS6 are depicted. Note increased number of positive cells co-expressing Periostin and pS6. Most of these cells are in the migratory area (***p<0.001). (C) NOK-SI cells were subjected to biomechanical stimulation (load of 14% stretching at 6 cycles/min) at the indicated time points. (D) Western blot analysis for Periostin and pS6 expression in NOK-SI subjected to load assay. Non-stimulated cells (no load force) served as a control, and GAPDH was used as protein loading control.

