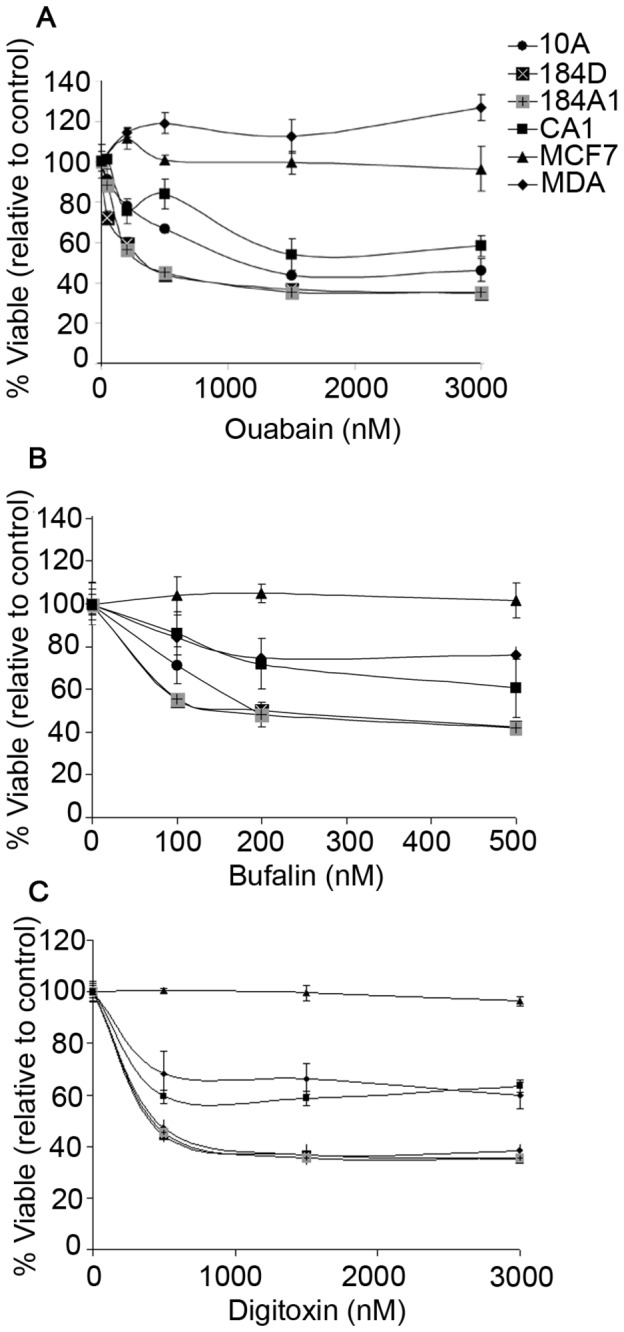
Figure 3. Viability of CTS-treated cells.

Normal 184D, 184A1, and MCF10A cells and tumorous MCF10CA1, MCF7, and MDA-MB-231 cells were treated with (A) ouabain (B) bufalin, or (C) digitoxin for 24 hours, and viability was determined by PrestoBlue Viability assay. Normal cells exhibited a concentration-dependent decrease in viability when treated with all CTS compounds tested. Tumor MCF7 and MDA-MB-231 cells were more resistant to CTS-induced cell death than MCF10A cells. Level of significance was determined (p<0.05) using ANOVA for group comparisons or Student’s t-test for individual comparisons.
