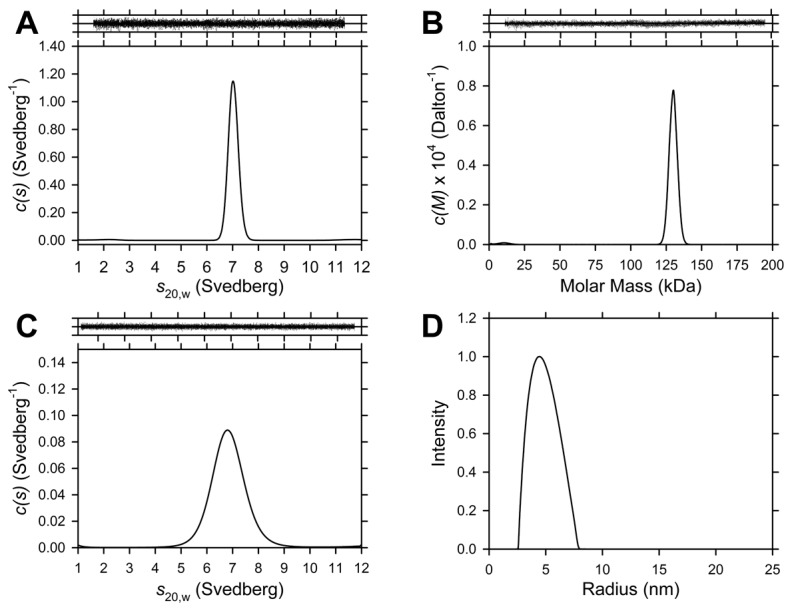
Figure 4. Sedimentation velocity and dynamic light scattering analyses of Sp-DHDPS.

(A) Continuous sedimentation coefficient, c(s), distribution of Sp-DHDPS at 4.5 µM plotted as a function of standardized sedimentation coefficient (s 20,w) with RMSD and runs test Z values for the best-fit of 0.008 and 6.6, respectively. (B) Continuous mass, c(M), distribution of Sp-DHDPS at a concentration of 4.5 µM plotted as a function of molar mass with RMSD and runs test Z values of 0.008 and 6.6 respectively. (C) c(s) distribution of Sp-DHDPS at 740 nM, with RMSD and runs test Z values of 0.02 and 1.64, respectively. Data were analyzed employing the program SEDFIT [51,52,65,66] using a resolution (N) of 200 and a sedimentation coefficient range of 0.1-12 S or molar mass range 1.0-250 kDa with a P-value of 0.95. Above Panels A-C: Residuals plotted as a function of radial position resulting from continuous size-distribution best-fits shown in panels A-C. (D) A distribution plot of the average unweighted hydrodynamic radii of Sp-DHDPS at a concentration of 59 µM determined using dynamic light scattering (DLS). The results of the distribution plot reveal an average hydrodynamic radius of 4.5 ± 0.2 nm.
