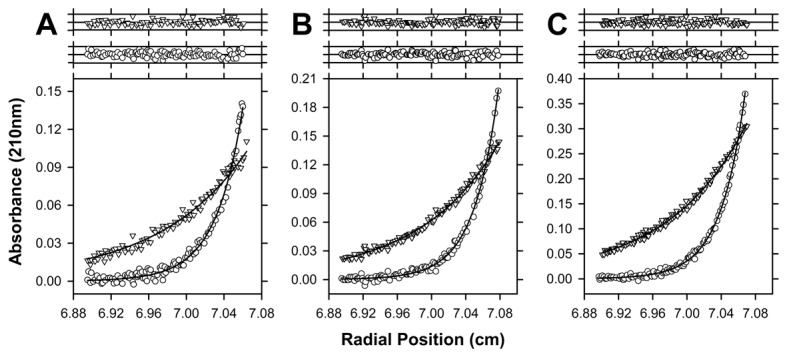
Figure 5. Sedimentation equilibrium analyses of Sp-DHDPS.

Absorbance at sedimentation equilibrium is plotted as a function of radial position for Sp-DHDPS at an initial concentration of (A) 296 nM; (B) 355 nM and (C) 740 nM. Data was measured at 210 nm and rotor speeds of 10,000 rpm () and 18,000 rpm (). The resulting global nonlinear least squares fit to a dimer-tetramer equilibrium model is shown as solid lines and yielded a KD 4à2 of 1.7 nM with a global reduced χ2 of 0.5. Above Panels A-C: Residuals plotted as a function of radial position resulting from the global nonlinear best-fit analysis to a dimer-tetramer model for data at 10,000 rpm () and 18,000 rpm ().
