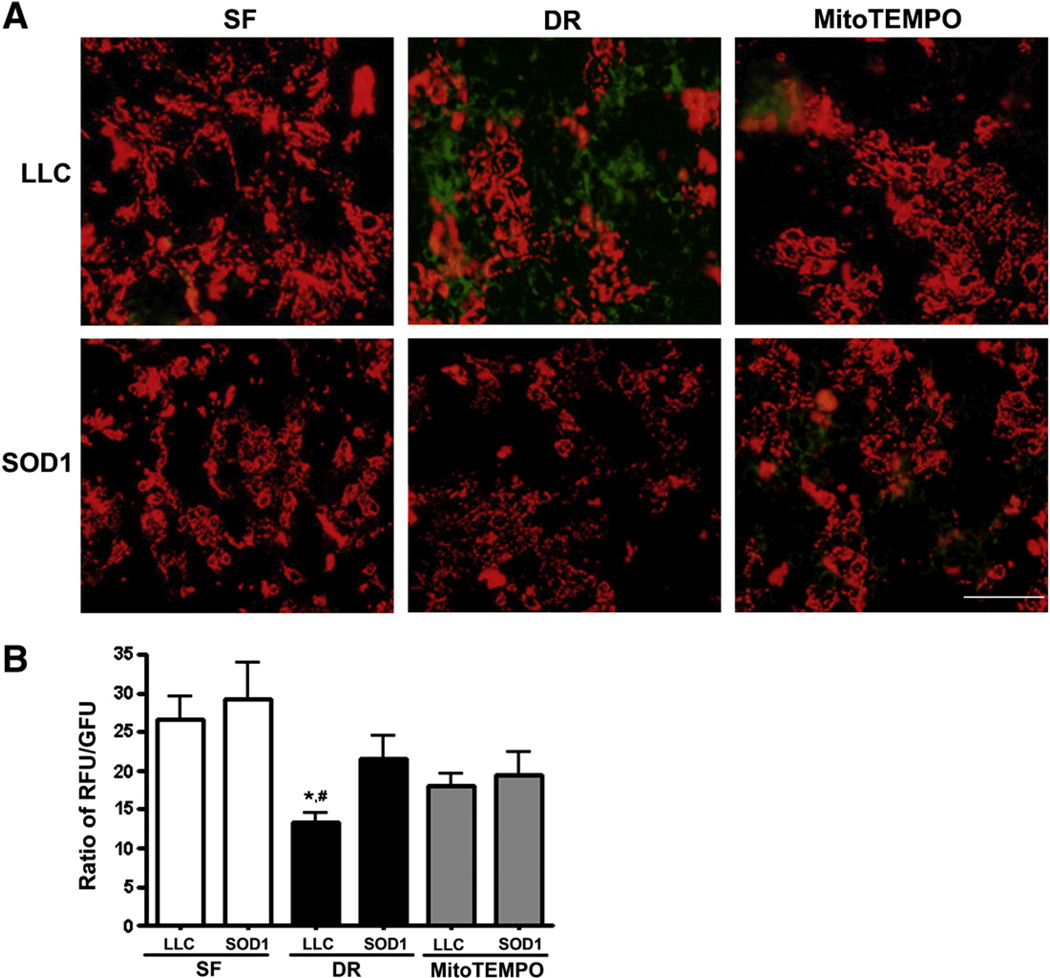
Fig. 4.
SOD1 over-expression and MitoTEMPO prevent the loss of loss of ΔΨm as measured by JC-1. As in Fig 2, cells were exposed to 1h-1h ATP-DR A: Representative JC-1 images of LLC-PK1 (top panel) and LLC-SOD1 (low panel) cells. B: Quantitation of JC-1 fluorescence. Results are ratios of red to green JC-1 fluorescence and presented as means ± SEM (N=9 for all groups). * P < 0.05 vs. SOD1-DR; #, P < 0.01 vs. SF. Scale bar = 40 µm.

