
Fig. 2.
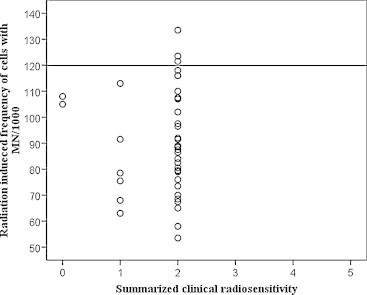
Radiation induced frequency of cells with MN/1000 in cancer patient, compared with summarized clinical radiosensitivity. Straight line shows the limit set by the mean frequency of radiation induced cells with MN/1000 of the control group plus twice the standard deviation (119.9).