

Abstract
Background
The aim of the modern radiotherapy is to get a homogenous dose distribution in PTV, which is obtained by using for example physical or dynamic wedges. The using of a physical wedge has provided such isodose distributions but their use resulted in detrimental dosimetric consequences, for example beam hardening effects and practical consequences of filter handling or possible misalignment. Linear accelerators are now equipped with collimator jaws systems and controlled by modern computers and it is possible to generate wedge shaped isodose distributions dynamically. Because of a more comfortable use of a dynamic wedge, there are alternatives to the standard physical wedge. During the treatment, different segments of the treatment field can be exposed to the primary beam at different intervals of time. This process of shrinking the field while modulating the collimator jaw velocity and dose rate creates the desired wedge-shaped isodose gradient across the treatment field. Dynamic wedges can replace physical wedges but they need more precise dosimetry and quality control procedures.
Aim
The aim of this study was to perform a multienergetic verification of dynamic wedge angles using the multichannel detector PTW LA48 linear array.
Material and methods
The measurements of angle value of dynamic wedges were performed for Clinac 2300 C/D accelerators (Varian). The accelerator was equipped with the EDW option for 6 MV and 15 MV photon beams. In this case, 7 wedge angle values were used: 10°, 15°, 20°, 25°, 30°, 45° and 60°. The dynamic wedges are realized by continuous movement of one collimator jaw. The field size is gradually reduced until the collimator is almost completely closed or the field increases, while the beam is on. The measurements were divided in two steps: in the first step, the dynamic wedges were verified with the recommended values and in the second step there the planned and measured angles of dynamic wedges were compared. Measurements were made by means of LA48 linear array of ionization chambers (PTW). The results of the measurements were compared with the reference profile produced by the treatment planning system ECLIPSE 8.5 (Varian).
Results
The results showed differences between measured and calculated angle of dynamic wedges. The differences were observed for both energies in the case of a small angle value. For energies 6 MV and 15 MV, almost all percentage difference between the measured and calculated profile was lower than 5%. The biggest difference was observed in the first step of measurements when the angle of Dynamic Wedge was verified. The comparison between the planned and measured angle value of Dynamic Wedge showed the difference between 0.1% and 4.5%.
The difference for 6 MV for the angle value of 10° in orientation IN was 1.1% and for energy 15 MV in the same case the difference was 3.8%. Thinner wedges exhibit less difference.
Conclusion
It is necessary to provide comprehensive quality control procedure for enhanced dynamic wedges. Verification measurements should be an obligatory procedure in the recommendation for the testing of medical accelerators. These results are the preliminary results to provide measurements in other Polish Cancer Centres.
Keywords: Dynamic wedges, Physical wedges, Linear array, Radiotherapy
1. Background
Radiotherapy is one of the methods for treatment of cancer and is used in about 50% of tumours diagnosed in the population. For treatment of cancer external beam photon radiotherapy is used. This kind of treatment uses several different radiation beams from various directions which intersect at the tumour or target within the patient.1 The purpose of modern radiotherapy is to receive an optimal dose distribution in target volume while sparing healthy tissue. It is possible to very precisely irradiate the volume of tumour sparing healthy tissue near the tumour owing to a rapid development of medical equipment resulting in new technologies in radiotherapy.1
In the process of radiotherapy, it is very important to use modern equipment for irradiation. Linear accelerators are important equipment in the process of cancer treatment. Nowadays, medical accelerators are used to achieve medical goals. The accelerators are equipped with different kinds of equipment which are used to modulate dose distribution in patient body. The individual patient anatomy demand the use of wedge shaped isodose distributions to compensate for missing tissue, irregular surface and irregular tumour volumes.1 Among solutions used are: boluses, individual shields, multileaf collimators, physical wedges and dynamic wedges, IMRT (Intensity Modulated Radiotherapy), VMAT. However, in many clinical situations, physical wedges can be used, even though they have many limitations, such as specified limit values of physical wedges, available wedging dimensions smaller than that for open fields, long irradiation times, change of power spectrum after the beam crosses the wedge, and possible collisions of the wedge holder with the therapeutic table in isocentric techniques.2,4 The medical accelerator Clinac is equipped with four sigmoidal, physical wedges of stainless steel as standard accessories (15°, 30°, 45°, 60°). The 15°, 30° physical wedges are optimized to accommodate the maximum field size of 20 cm × 40 cm and the 60° can accommodate a maximum field size of 15 cm × 40 cm.
The use of physical wedge have provided such isodose distributions but resulted in detrimental dosimetric consequences, for example, beam hardening effects, and practical consequences of filter handling or possible misalignment.1,3 Linear accelerators are now controlled by modern computers and it is possible to generate wedge-shaped isodose distributions dynamically. Being more convenient to use, dynamic wedges are alternative to the standard physical wedges. Dynamic wedges are the system of collimator jaws controlled by a computer. Collimator jaws motions are used to adjust the most optimal dose distributions.4 Because of the jaw motion, different parts of the field are exposed to the primary beam for different lengths of time. This creates a wedged dose gradient across the field. During the treatment, different segments of the field can be exposed to the primary beam for different intervals of time. This process of shrinking the field while modulating the collimator jaw velocity and dose rate creates the desired wedge-shaped isodose gradient across the treatment field.1 For the first time modulation of radiation beam using dynamic wedge shape was proposed by Kijewski in 1978.5 One of the first commercial products using dynamic wedges was introduced in the early 90s by Varian and it provided four wedge angles of 15°, 30°, 45° and 60°. The company has equipped a linear accelerator Clinac series C. Dynamic wedges were significantly improved by the introduction of Enhanced Dynamic Wedges (EDWs). An EDW has seven wedge angles (10°, 15°, 20°, 25°, 30°, 45° and 60°) for both symmetric and asymmetric field sizes.6,7 The collimator is equipped with four independent jaws. The upper jaws are assigned as Y1 and Y2; they can move from a full open position to 10 cm across the central axis, thus allowing field sizes of up to 30 cm along the wedge direction. Indicating the moving jaw two wedge orientations are available: (Y1)-IN and (Y2)-OUT.8 To programme the Dynamic Wedges (DWs) 256 Segmented Treatment Tables (STTs) were used providing continuous outputs as a function of jaw positions for all beam energies of symmetrical fields within the range of 4–20 cm.7 The STTs are implemented on Varian Clinac console to control the dose rate and jaw movement to produce a set of DWs. STTs include also information on the moving collimator position versus cumulative weighting of monitor units. The EDWs which are the second generation of DWs use a single STT.7 The distributions of doses obtained during irradiation using a dynamic wedge is similar to the that we can receive during irradiation with the use of a physical wedge filter. The parameter which characterizes both the physical and dynamic wedges is angle. In the Varian implementation the dynamic wedge angle is defined differently than for physical wedge angles,9,10 Figs. 1 and 2.11,12 The angle for physical wedge is defined for the field size of 10 cm × 10 cm, this is the angle between 80% of isodose profile and the perpendicular to the axis beam. Opposite to physical wedges, EDWs are determined by the angle between the line crossing in 2 points the 80% of the isodose, lying at 1/4 cm of the axis at the isodose which goes through the central beam axis at the 10 cm depth by means of draw of the 10 cm profile and make a perpendicular to the beam axis. The field width is divided into four equal parts and through points determined this way one can draw parallels to the beam axis.10,11 Many earlier studies described the physical properties of dynamic wedges.13–17
Fig. 1.
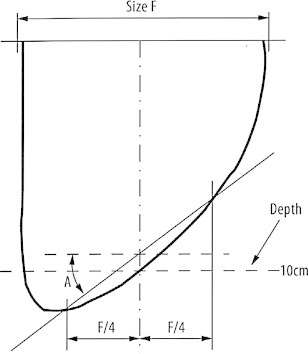
ICRU definitions of enhanced dynamic wedges, where A is wedge angle.
Fig. 2.
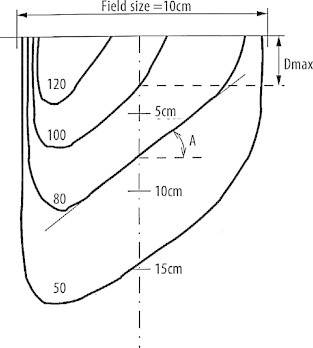
The definition of physical wedge, where A is wedge angle as recommended by C.B. Hughes, C.J. Karzmark and R.M. Levy.
A dynamic wedge must be tested before clinical implementation by measuring pertinent beam characteristics, thereby determining the reliability of this technology. Dynamic wedge filters require the development of quality assurance principles and values accurately reflecting the wedges recommended by the manufacturer in clinical settings.
2. Aim
Due the fact that the verification of the wedges is necessary for a precise application of quality control and appropriate dosimetric instrument, the aim of this study was to verify dynamic wedge angles using multichannel linear array detector for 2 photon energies of 6 MV and 15 MV.
3. Material and methods
The measurements of dynamic wedges were performed for Clinac 2300C/D accelerator from Varian Medical System (Varian Oncology System, Paolo Alto, California) with two photon energies: 6 MV and 15 MV. The accelerator was equipped with Varian Millennium dynamic multileaf collimator consisting of 60 pairs of leaves. In this case, 7 wedge angle values were used: 10°, 15°, 20°, 25°, 30°, 45° and 60°. The dynamic wedges are realized by a continuous movement of one collimator jaw. Because of this, in the case of EDWs, there are no hardening effects. The field size used was 20 cm × 20 cm for measurements and the angle of dynamic wedge was measured by means of LA48 liner array in water phantom MP3 (PTW – Freiburg). The LA48 linear chamber array is used for fast, accurate and reliable dynamic field dosimetry measurements of virtual wedges and multileaf collimators. The precision of measurement is about 0.5% based on repeated measurements. The array has a measuring length of 37 cm and contains 48 fluid filled 8 mm3 ion chambers, each 4 mm × 4 mm × 0.5 mm, spaced 8 mm to the centre. The ionization chambers are located one by one along an aluminium bar. The efective point of LA48 was located for each ionization chamber at the depth of 8 mm The software makes it possible to measure the dose profile at 2 mm intervals.12 The water phantom was equiped with a fixing frame to which an array of chambers was fixed. The Linear Array was located along the water phantom in the lateral position at the depth of 10 cm by means of a Control Unit and electronical pendat.
4. AAA algorithm
The dose was calculated with the AAA algorithm (Analytical Anisotropic Algorithm). It is a 3D pencil beam convolution-superposition algorithm. It was implemented by Varian in treatment planning system Eclipse. The AAA dose calculation model consists of two components, the configuration algorithm and the actual dose calculation algorithm.17 The body of patients is divided into voxels determined by the size of the chosen calculation grid. The voxels are divergent and aligned with the beam fan line. For each voxel, the mean electron density is computed based on CT images. The beam is then divided into small beamlets where the cross section of the beamlet matches the voxel. For each beamlet, the dose is calculated based on the three different sources and their properties.19
5. Geometry of measurements
The study was divided into two steps. The measurements were made in the same geometry conditions. The source to phatnom surface distance was 100 cm The collimator and the gantry rotation angle were set to 0°. The measurement was made using the software of the Mephysto (v.2.0) system from PTW. The dose profile was measured in each of 48 ionization chambers with 8 mm step at the depth of 10 cm in water, prependicurarly to the beam axis and parallelly to the direction of the jaw movement. For this study the field of 20 cm × 20 cm was used.
In the first step, the angle value of dynamic wedge was verified and compared with the recommended value. In the second step, the dynamic wedge value planned in Treatment Planning System (TPS) was compared with the measured value. The geometrical conditions of LA48 position was the same as in the first step. The second target was implemented using theTreatment Planning System (TPS). The treatment field of 20 cm × 20 cm was created in TPS and the dynamic wedges were added. In this step, TPS calculated the time do delivery the radiation. After the measurement, the profile was compared with the planned profile. The measurement data were read in the Mephysto system which allowed an automatic wedge angle calculation:
where:
Dose values D1, D2 at positions “field size/4” and “-field size/4” of the profile at the depth of 10 cm; D100, D200 – dose values at positions 100 mm and 200 mm of the depth dose curve.
Development of detailed test methods and analysis of results, and achievement of positive results will allow future tests to be provided for the second stage in other Oncology Centres for different energy photon irradiation.
6. Results and discussion
The measurement were made on Clinac 2300C/D at the Greater Cancer Poland Centre in Poznan, for photon energy modes of 6 MV and 15 MV. The results of the study were reported to the recommendation of the manufacturer. The tables below show the compatibility between the calculated and measured values of wedge angles. The measurements were made in two steps. In the first step, the value of angle was verified with the recommendation. In second step, the planned value of dynamic wedge was compared with planned value. Table 1 shows the values recommended by the manufacturer and the measured ones. The values were compared and the percentage difference was calculated. The least percentage difference was found for the small angle value. For the energy of 6 MV, the difference was in the range from 4.6% to 1.1%. Figs. 3–16 present the profile of dynamic wedge for energy mode of 6 MV in both orientation IN and OUT. The 0 coordinate was assigned to the field centre and at this point both profiles were normalized to 100%.
Table 1.
The recommended values [R] and measured values [M] for EDW for energy 6 MV.
| Orientation of EDW | R [°] | M [°] | Difference [°] | Percentage difference [%] |
|---|---|---|---|---|
| IN | 10 | 10.11 | 0.11 | 1.1 |
| OUT | 10 | 9.99 | 0.01 | −0.10 |
| IN | 15 | 14.94 | 0.16 | −0.40 |
| OUT | 15 | 14.68 | 0.32 | −2.13 |
| IN | 20 | 19.73 | 0.27 | −1.30 |
| OUT | 20 | 19.69 | 0.31 | −1.60 |
| IN | 25 | 23.77 | 1.23 | 0.52 |
| OUT | 25 | 24.02 | 0.98 | −3.92 |
| IN | 30 | 28.39 | 0.85 | −2.80 |
| OUT | 30 | 28.56 | 1.44 | −4.80 |
| IN | 45 | 42.96 | 1.55 | −3.4 |
| OUT | 45 | 42.96 | 1.92 | −4.3 |
| IN | 60 | 58.05 | 1.95 | −3.25 |
| OUT | 60 | 58.18 | 1.82 | −3.03 |
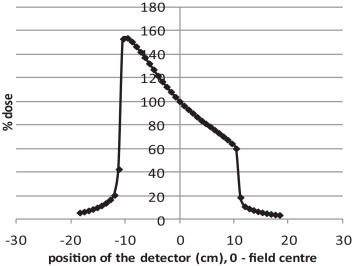
Fig. 3.

A measured off-axis dose profile for an EDW10 in orientation IN for field size 10 cm × 10 cm at the depth and an X-6 MV.
Fig. 4.

A measured off-axis dose profile for an EDW10 in orientation IN for field size 10 cm × 10 cm at the depth and an X-6 MV.
Fig. 5.

A measured off-axis dose profile for an EDW15 in orientation IN for field size 10 cm × 10 cm at the depth and an X-6 MV.
Fig. 6.

A measured off-axis dose profile for an EDW15 in orientation ON for field size 10 cm × 10 cm at the depth and an X-6 MV.
Fig. 7.

A measured off-axis dose profile for an EDW20 in orientation IN for field size 10 cm × 10 cm at the depth and an X-6 MV.
Fig. 8.

A measured off-axis dose profile for an EDW20 in orientation ON for field size 10 cm × 10 cm at the depth and an X-6 MV.
Fig. 9.

A measured off-axis dose profile for an EDW25 in orientation IN for field size 10 cm × 10 cm at the depth and an X-6 MV.
Fig. 10.

A measured off-axis dose profile for an EDW25 in orientation ON for field size 10 cm × 10 cm at the depth and an X-6 MV.
Fig. 11.

A measured off-axis dose profile for an EDW30 in orientation IN for field size 10 cm × 10 cm at the depth and an X-6 MV.
Fig. 12.

A measured off-axis dose profile for an EDW30 in orientation ON for field size 10 cm × 10 cm at the depth and an X-6 MV.
Fig. 13.
A measured off-axis dose profile for an EDW45 in orientation IN for field size 10 cm × 10 cm at the depth and an X-6 MV.
Fig. 14.

A measured off-axis dose profile for an EDW45 in orientation ON for field size 10 cm × 10 cm at the depth and an X-6 MV.
Fig. 15.

A measured off-axis dose profile for an EDW60 in orientation IN for field size 10 cm × 10 cm at the depth and an X-6 MV.
Fig. 16.

A measured off-axis dose profile for an EDW60 in orientation IN for field size 10 cm × 10 cm at the depth and an X-6 MV.
Table 2 shows the same measurements but for the energy 15 MV mode. In this case we can see that the difference were smaller in the range from 3.80% to 0.10%. Figs. 17–30 present the profile of dynamic wedge for energy mode of 15 MV in both orientation IN and OUT. The 0 coordinate was assigned to the field centre and at this point both profiles were normalized to 100%.
Table 2.
The recommended values [R] and measured values [M] for EDW for energy 15 MV.
| Orientation of EDW | R [°] | M [°] | Difference | Percentage difference [%] |
|---|---|---|---|---|
| IN | 10 | 10.38 | −0.38 | 3.80 |
| OUT | 10 | 10.34 | 0.34 | 3.40 |
| IN | 15 | 15.06 | −0.06 | 0.40 |
| OUT | 15 | 15.22 | 0.28 | 1.50 |
| IN | 20 | 19.35 | 0.65 | −3.30 |
| OUT | 20 | 20.02 | 0.02 | 0.10 |
| IN | 25 | 24.7 | 0.30 | −1.20 |
| OUT | 25 | 24.91 | 0.90 | −0.40 |
| IN | 30 | 29.45 | 0.55 | −1.83 |
| OUT | 30 | 29.71 | 0.29 | −1.00 |
| IN | 45 | 43.94 | 1.06 | −2.36 |
| OUT | 45 | 44.31 | 0.69 | −1.50 |
| IN | 60 | 58.95 | 1.05 | −1.75 |
| OUT | 60 | 59.03 | 0.97 | −1.60 |
Fig. 17.
A measured off-axis dose profile for an EDW10 in orientation IN for field size 10 cm × 10 cm at the depth and an X-15 MV.
Fig. 18.

A measured off-axis dose profile for an EDW10 in orientation OUT for field size 10 cm × 10 cm at the depth and an X-15 MV.
Fig. 19.

A measured off-axis dose profile for an EDW25 in orientation IN for field size 10 cm × 10 cm at the depth and an X-15 MV.
Fig. 20.

A measured off-axis dose profile for an EDW15 in orientation OUT for field size 10 cm × 10 cm at the depth and an X-15 MV.
Fig. 21.

A measured off-axis dose profile for an EDW20 in orientation IN for field size 10 cm × 10 cm at the depth and an X-15 MV.
Fig. 22.

A measured off-axis dose profile for an EDW20 in orientation OUT for field size 10 cm × 10 cm at the depth and an X-15 MV.
Fig. 23.

A measured off-axis dose profile for an EDW25 in orientation IN for field size 10 cm × 10 cm at the depth and an X-15 MV.
Fig. 24.

A measured off-axis dose profile for an EDW25 in orientation OUT for field size 10 cm × 10 cm at the depth and an X-15 MV.
Fig. 25.

A measured off-axis dose profile for an EDW30 in orientation IN for field size 10 cm × 10 cm at the depth and an X-15 MV.
Fig. 26.

A measured off-axis dose profile for an EDW30 in orientation OUT for field size 10 cm × 10 cm at the depth and an X-15 MV.
Fig. 27.

A measured off-axis dose profile for an EDW45 in orientation IN for field size 10 cm × 10 cm at the depth and an X-15 MV.
Fig. 28.

A measured off-axis dose profile for an EDW45 in orientation OUT for field size 10 cm × 10 cm at the depth and an X-15 MV.
Fig. 29.

A measured off-axis dose profile for an EDW60 in orientation IN for field size 10 cm × 10 cm at the depth and an X-15 MV.
Fig. 30.

A measured off-axis dose profile for an EDW60 in orientation OUT for field size 10 cm × 10 cm at the depth and an X-15 MV.
Table 3 shows results of the comparison between planned values and measured values for EDW for the energy of 6 MV. The biggest difference was for the orientation OUT. The difference was between −0.20% and 4.5%. Profiles of the wedges were compared. The nominal difference was below 2°, with the biggest one for the small value of angle.
Table 3.
The planned values [P] and measured values [M] for EDW for energy 6 MV.
| Orientation of EDW | P [°] | M [°] | Difference [°] | Percentage difference [%] |
|---|---|---|---|---|
| IN | 10 | 10.05 | 0.05 | −0.20 |
| OUT | 10 | 9.58 | 0.42 | −4.20 |
| IN | 15 | 14.90 | 0.10 | −0.70 |
| OUT | 15 | 14.33 | 0.77 | −4.50 |
| IN | 20 | 19.67 | 0.33 | −1.60 |
| OUT | 20 | 19.20 | 1.01 | −4.00 |
| IN | 25 | 24.85 | 0.15 | 0.60 |
| OUT | 25 | 24.39 | 0.61 | −2.40 |
| IN | 30 | 29.16 | 0.84 | −2.80 |
| OUT | 30 | 28.79 | 1.21 | 4.20 |
| IN | 45 | 44.17 | 0.83 | 1.88 |
| OUT | 45 | 43.58 | 1.42 | 3.26 |
| IN | 60 | 59.05 | 0.95 | 1.61 |
| OUT | 60 | 58.76 | 1.24 | 2.11 |
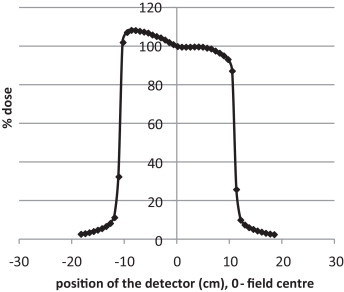
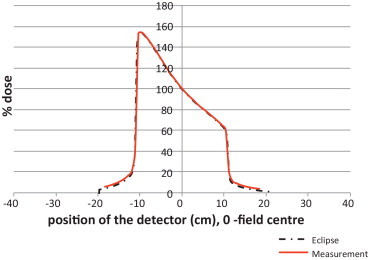
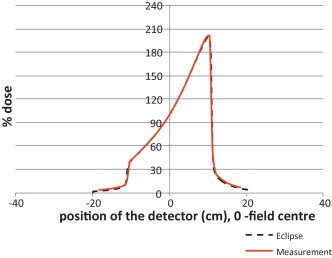
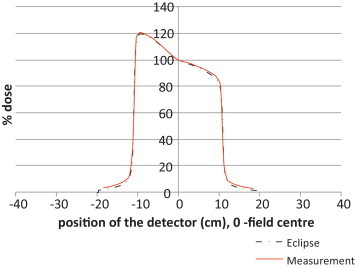
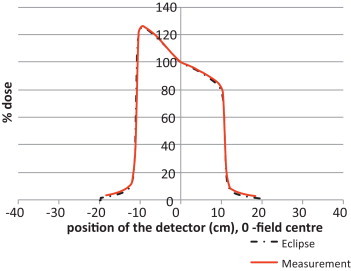
The measured and planned profiles for each of them were overlap. The profiles were read by the Mephysto system. The profiles were calculated using the same geometrical conditions as used for measurements. The dynamic wedges were calculated in a virtual water phantom. Figs. 31–56 show the comparison of the measured profiles of each value of a dynamic wedge with those calculated by the Eclipse treatment planning system to demonstrate observed differences.
Fig. 31.

The measured profile of EDW for angle value 10° with using orientation IN and 6 MV beam for field size 20 cm × 20 cm at the depth 10 cm.
Fig. 32.

The measured profile of EDW for angle value 10° with using orientation ON and 6 MV beam for field size 20 cm × 20 cm at the depth 10 cm.
Fig. 33.

The measured profile of EDW for angle value 15° with using orientation IN and 6 MV beam for field size 20 cm × 20 cm at the depth 10 cm.
Fig. 34.

The measured profile of EDW for angle value 15° with using orientation ON and 6 MV beam for field size 20 cm × 20 cm at the depth 10 cm.
Fig. 35.

The measured profile of EDW for angle value 20° with using orientation IN and 6 MV beam for field size 20 cm × 20 cm at the depth 10 cm.
Fig. 36.

The measured profile of EDW for angle value 20° with using orientation ON and 6 MV beam for field size 20 cm × 20 cm at the depth 10 cm.
Fig. 37.

The measured profile of EDW for angle value 25° with using orientation IN and 6 MV beam for field size 20 cm × 20 cm at the depth 10 cm.
Fig. 38.

The measured profile of EDW for angle value 25° with using orientation ON and 6 MV beam for field size 20 cm × 20 cm at the depth 10 cm.
Fig. 39.

The measured profile of EDW for angle value 30° with using orientation IN and 6 MV beam for field size 20 cm × 20 cm at the depth 10 cm.
Fig. 40.

The measured profile of EDW for angle value 30° with using orientation ON and 6 MV beam for field size 20 cm × 20 cm at the depth 10 cm.
Fig. 41.
The measured profile of EDW for angle value 45° with using orientation IN and 6 MV beam for field size 20 cm × 20 cm at the depth 10 cm.
Fig. 42.

The measured profile of EDW for angle value 45° with using orientation ON and 6 MV beam for field size 20 cm × 20 cm at the depth 10 cm.
Fig. 43.

The measured profile of EDW for angle value 45° with using orientation IN and 6 MV beam for field size 20 cm × 20 cm at the depth 10 cm.
Fig. 44.
The measured profile of EDW for angle value 45° with using orientation OUT and 6 MV beam for field size 20 cm × 20 cm at the depth 10 cm.
Fig. 45.

The measured profile of EDW for angle value 10° with using orientation IN and 15 MV beam for field size 20 cm × 20 cm at the depth 10 cm.
Fig. 46.

The measured profile of EDW for angle value 10° with using orientation OUT and 15 MV beam for field size 20 cm × 20 cm at the depth 10 cm.
Fig. 47.

The measured profile of EDW for angle value 15° with using orientation IN and 15 MV beam for field size 20 cm × 20 cm at the depth 10 cm.
Fig. 48.

The measured profile of EDW for angle value 15° with using orientation OUT and 15 MV beam for field size 20 cm × 20 cm at the depth 10 cm.
Fig. 49.

The measured profile of EDW for angle value 20° with using orientation IN and 15 MV beam for field size 20 cm × 20 cm at the depth 10 cm.
Fig. 50.

The measured profile of EDW for angle value 20° with using orientation OUT and 15 MV beam for field size 20 cm × 20 cm at the depth 10 cm.
Fig. 51.
The measured profile of EDW for angle value 25° with using orientation OUT and 15 MV beam for field size 20 cm × 20 cm at the depth 10 cm.
Fig. 52.

The measured profile of EDW for angle value 25° with using orientation OUT and 15 MV beam for field size 20 cm × 20 cm at the depth 10 cm.
Fig. 53.
The measured profile of EDW for angle value 30° with using orientation IN and 15 MV beam for field size 20 cm × 20 cm at the depth 10 cm.
Fig. 54.

The measured profile of EDW for angle value 30° with using orientation OUT and 15 MV beam for field size 20 cm × 20 cm at the depth 10 cm.
Fig. 55.

The measured profile of EDW for angle value 45° with using orientation IN and 15 MV beam for field size 20 cm × 20 cm at the depth 10 cm.
Fig. 56.

The measured profile of EDW for angle value 45° with using orientation OUT and 15 MV beam for field size 20 cm × 20 cm at the depth 10 cm.
The measurement for the energy of 15 MV shows smaller differences between planned and measured values. The difference was for the EDW 10 in orientation IN. In this case again, the biggest differences were for the smallest value of angle.
Authors Paola Caprile, Carlos Daniel Venencia and Pelayo Besa compared in their study measured and calculated dynamic wedge dose distributions using an anisotropic analytic algorithm and pencil beam convolution. The measurements were made by means of the ionization chamber for axis beam measurements and films for dose distributions. The calculations were performed using both algorithms by TPS for symmetric fields in a perpendicular configuration. As individual acceptance criteria, a 3% dose variation and 3 mm distance to agreement were used. Percentage depth dose calculation and beam axis wedge factors were within 1% deviation between calculated and measured values. Both algorithms reproduced the measured profiles within the acceptance criteria of up to 30° EDW, in the wedge direction. When the wedge angles were larger the difference increased to 3%.20
Authors Krzysztof Chełmiński, Wojciech Bulski, Joanna Rostkowska and Małgorzata Kania presented Quality Assurance procedures and examples of systematic errors which had been detected and corrected in dynamic accessories used in the Treatment Planning System (TPS) before clinical implementation. The results of measurements showed a considerable difference between measured and calculated values. For larger wedge angles and lower energies the differences were larger. On the basis of the results, TPS manufacturers were able to tune their calculation algorithms. The changes make it possible to reduce the differences from the level of -5.5% for the energy of 15 MV and −8% for 6 MV for the angle value of 60° to the level of ±2% for the Helax system (Table 4).
Table 4.
The planned values [P] and measured values [M] for EDW for energy 15 MV.
| Orientation of EDW | P [°] | M [°] | Difference [°] | Percentage difference [%] |
|---|---|---|---|---|
| IN | 10 | 9.55 | 0.45 | −4.5 |
| OUT | 10 | 9.97 | 0.03 | 0.30 |
| IN | 15 | 14.44 | 0.56 | −3.7 |
| OUT | 15 | 14.78 | 0.22 | 1.49 |
| IN | 20 | 19.25 | 0.75 | −3.8 |
| OUT | 20 | 20.01 | 0.01 | 0.1 |
| IN | 25 | 24.16 | 0.84 | −3.4 |
| OUT | 25 | 24.88 | 0.12 | −0.5 |
| IN | 30 | 29.67 | 0.33 | −1.1 |
| OUT | 30 | 29.67 | 0.33 | −1.1 |
| IN | 45 | 43.78 | 0.22 | −2.7 |
| OUT | 45 | 44.22 | 0.68 | −1.5 |
| IN | 60 | 58.77 | 1.23 | −2.1 |
| OUT | 60 | 58.17 | 0.83 | −1.4 |
The study by Chang S.X. and Gibbons J.P. “Clinical Implementation of Non-Physical Wedges”, AAPM Refresher Course of 1999, presented the dependences from field size, depth and off-axis. Because of this the geometry of measurements, it is very important to avoid measurements mistakes.
7. Conclusion
Conducting a wide range of measurements allowed to state clearly the compatibility of the measured values of dynamic wedges specified by the manufacturer with the dynamic wedge values obtained in a clinical setting. Verification of the second stage led to the conclusion concerning the correctness of the delivery of the Treatment Planning System for therapeutic apparatus which proved the correctness and precision for radiotherapy patients. It is necessary to provide the measurement by using professional equipment and well calibrated Linear Array. Very important is also the mapping of reference conditions to the measurements. Development of detailed test methods and analysis of results and the achievement of positive results will allow future tests to be provided in the second stage in other Oncology Centres for different energy photon radiations.30
Conflict of interest
There was no conflict of interest.
Financial disclosure
None declared.
References
- 1.Barry D.P. McGill University; 1996. Dynamic wedge dosimetry on a dual energy linaear accelerator, Masters Thesis. [Google Scholar]
- 2.Janiszewska M., Nowakowski G. Dosimetric verification of dynamic wedged fields. Rep Pract Oncol Radiother. 2003;8(4):139–142. [Google Scholar]
- 3.Chełmiński K., Bulski W., Rostkowska j, Kania M. Dynamic wedges – dosimetry and quality control. Rep Pract Oncol Radiother. 2006;11(2):67–75. [Google Scholar]
- 4.Chełmiński K., Bulski W., Rostkowska j., Kania M. Measurement of the sensitometric curves of Kodak EDR2 and X-Omat V films Rusing Enhaced Dynamic Wedges and Dynamic Multileaf Collimator. Rep Pract Oncol Radiother. 2005;10(6):293–300. [Google Scholar]
- 5.Kijewski P.K., Chin L.M., Ebjarngard B. Wedge-shaped dose distributions by computer-controlled collimator motion. Med Phys. 1978;5:426–429. doi: 10.1118/1.594440. [DOI] [PubMed] [Google Scholar]
- 6.Varian Oncology System. C-Series Clinac enhanced dynamic wedge implementation guide; 1996.
- 7.Klein E.E., Low D.A., Meigooni A.S., Purdy J.A. Dosimetry and clinical implementation of dynamic wedge. Radiat Oncol Biol Phys. 1995;31(3):307–316. doi: 10.1016/0360-3016(94)00369-V. [DOI] [PubMed] [Google Scholar]
- 8.Huntzinger C.J. Dynamic wedge: a physicist's perspective. Varian dynamic wedge users's meeting proceedings; Calagary; 1992. [Google Scholar]
- 9.Varian Oncology systems. C-Series Clinac enhanced dynamic wedge implementation guide; 1996.
- 10.International Commission on radiation Units and Measurements. Determination of Absorbed Dose in a Patient Irradiated by Beams of X ora Gamma Rays in Radiotherapy Procedures, ICRU report 24; 1976.
- 11.International Electrotechnical Commission . IEC performance standard 976, Geneva. 1989. Medical electron accelerators – functional performance characteristics. [Google Scholar]
- 12.Huges D.B., Karzmark C.J., Levy R.M. Conventions for wedge filters specifications. Br Radiol. 1972;45:868. doi: 10.1259/0007-1285-45-539-868-a. [DOI] [PubMed] [Google Scholar]
- 13.Leavitt D.D., Larson L. Evaluation of a diode detector array for measurement of dynamic wedge dose dystybutions. Med Phys. 1993;20:38182. doi: 10.1118/1.597165. [DOI] [PubMed] [Google Scholar]
- 14.Leavitt D.D., Moeller J.H., Stone A. Reduction of peripheral dose by dynamic wedge techniques. Med Phys. 1993;20(877) [Google Scholar]
- 15.Bidmead A.M., Garton A.J., Childs P.J. beam data measurements for dynamic wedges on varian 600C (6 MV) abd 2100C (6 and 10 MV) linear accelerators. Phys Med Biol. 1995;40:393–411. doi: 10.1088/0031-9155/40/3/005. [DOI] [PubMed] [Google Scholar]
- 16.http://www.ptw.de/la48_linear_chamber_array.html
- 17.Saminathan S., Manickam R., Supe S.S. Comparison of dosimetric characteristics of physical and enhanced dynamic wedges. Rep Pract Oncol Radiother. 2012;17(1):4–12. doi: 10.1016/j.rpor.2011.06.007. [DOI] [PMC free article] [PubMed] [Google Scholar]
- 19.Caprile P., Venencia C.D., Besa P. Compared measured and calculated dynamic wedge dose distributions using the anisotropic analytic algorithm and pencil beam convolution. J Appl Clin Med Phys. 2007;8(1) doi: 10.1120/jacmp.v8i1.2370. [DOI] [PMC free article] [PubMed] [Google Scholar]
- 20.Chełmiński K., Bulski W., Rostkowska J., Kania M. Dynamic Wedges – dosimetry and quality control. Rep Pract Oncol Radiother. 2006;11(2):67–75. [Google Scholar]
- 30.Malicki J. The importance of accurate treatment planning, delivery, and dose verification. Rep Pract Oncol Radiother. 2012;17(2):63–65. doi: 10.1016/j.rpor.2012.02.001. [DOI] [PMC free article] [PubMed] [Google Scholar]