
Fig. 5.
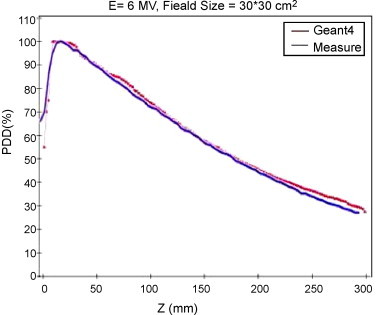
Depth-dose curve for the 30 cm × 30 cm field, with a 6-MV beam. The blue line refers to measured data, the red line refers to Geant4 Monte Carlo results.
Official websites use .gov
A
.gov website belongs to an official
government organization in the United States.
Secure .gov websites use HTTPS
A lock (
) or https:// means you've safely
connected to the .gov website. Share sensitive
information only on official, secure websites.
Depth-dose curve for the 30 cm × 30 cm field, with a 6-MV beam. The blue line refers to measured data, the red line refers to Geant4 Monte Carlo results.